PowerBlock RX Series units are factory configured to handle your house independent of the Grid. Our aim is to supply a modular system where the system can be updated to increase Solar generation and also the power storage in the future.
PowerBlock RX Series units are factory configured to handle your house independent of the Grid. Our aim is to supply a modular system where the system can be updated to increase Solar generation and also the power storage in the future.

Get free professional consultation and special discounts this Christmas season from Sri Lanka’s premier solar energy solutions provider JLanka Technologies. Choosing JLanka Technologies as your solar energy partner ensures to design your system using premium hardware and materials to guarantee a lifetime of trouble-free service. So why wait, hurry up and contact us today to enjoy these amazing discounts!

COVID-19 has changed the world in many ways, but it hasn’t stopped the demand for affordable electricity that reduces our carbon footprint. So how can solar power technology be installed in ways that protects family and loved ones? JLANKA is here to help. We put safety first – always – and give customers the best options in service and equipment.

Get free professional consultation and special discounts this avurudu
season from Sri Lanka’s premier solar energy solutions provider JLanka
Technologies. All you have to do is simply fill out the form linked below and
we will take care of the rest. This amazing offer will be available only from
8th to 30th April 2021. So don’t miss it out, hurry up and get registered
now.


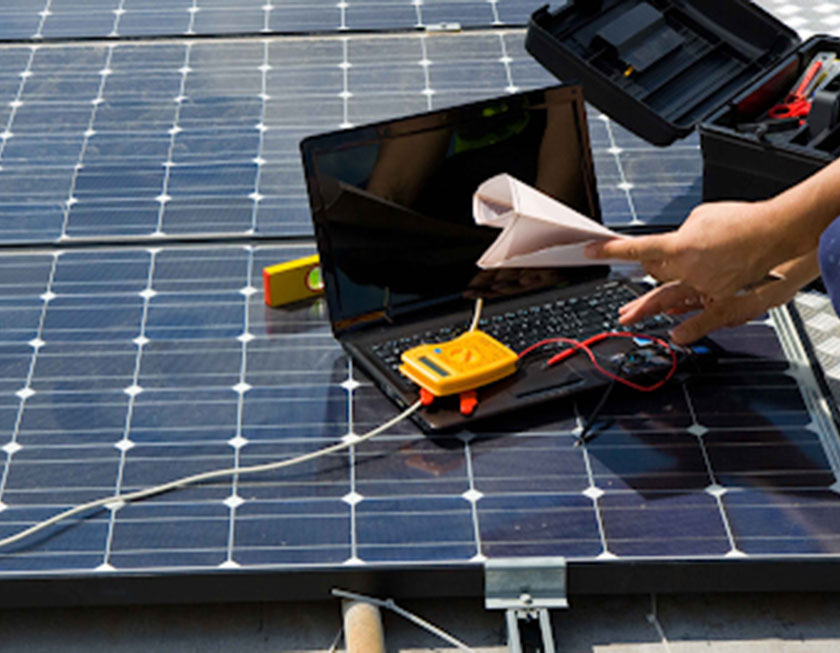
Owning solar panels is a valuable investment that not only reduces your electricity bill, it also reduces your carbon footprint by providing you with renewable energy for the next 20-25 years. Even though solar panels require comparatively less maintenance when compared to other power electronic devices installed in your residence or factory due to lack of moving parts, regular maintenance is still required to ensure that your investment is reaping the maximum long-term benefits.
Understanding what kind of maintenance is required is an important thing to consider before scheduling a visit with your solar pv service provider. There are two kinds of maintenance activities that can be carried out on your solar pv system, namely, Preventive Maintenance and Corrective Maintenance. Preventive Maintenance refers to activities undertaken to keep the generation losses to a minimum. On the other hand, Corrective Maintenance corresponds to returning the PV system back to a functioning state once a failure has occurred.

Preventive Maintenance mainly consists of the cleaning of solar panels and the management of vegetation surrounding the panels.
Even though rains clear off debris and dust to a certain extent, dust and particles collect on the solar panel limiting the amount of sunlight directly hitting your solar panel. Therefore, it is suggested to clean the panels at least twice an year in rural areas and up to four times an year in areas of high dust accumulation.
Every once in a while, it is important to check if nearby trees have grown to such an extent that they cast a shadow on the panels, or if the near by branches are now lying on top of the panels. This can reduce generation drastically as the panels can be covered almost completely, bringing the output from these panels to almost zero. Solutions such as the SolarEdge Power Optimizer ensures maximum generation even from partial generation, but prevention is always better than cure. Ask your service team to check for shading from vegetation and have it cleared just enough to ensure that the panels will not be affected for the next year or so.
It is recommended to carry out preventive maintenance at regular pre-determined intervals so that the reduction in generation is kept at a minimum.

Corrective Maintenance on the other hand requires a team to visit your system only when a fault occurs. Failures of the solar pv system can be identified through the remote monitoring system provided by the inverter manufacturer or through onsite inspection during a panel service. The fault may occur on the panel, optimizer, inverter or grid connection point.
Onsite inspection, electrical system testing, fault diagnosis and part replacement are not usually covered by the OEM Equipment Manufacturer, but the replacements parts are usually covered if the warranty conditions are met.
At the end of the day, if you notice any irregularities on your electricity bill or an anomaly on your monitoring portal, contact your service provider to have a look and make sure everything is as it should be.

Increment of shortage of energy resources such as fossil fuels and environmental related concerns such as increment of carbon footprint have motivated humans to develop and utilize renewable energy sources to produce electricity. Moving into power generation through solar photovoltaic energy has become a nowadays trend in the electricity market. A rapid growth in solar PV technology and the industry is seen over the past several years due to less installation and maintenance costs, less pollution nature and enormous support and promotions given from the government. However, the intermittency, variability and randomness of PV power also cause huge grid fluctuations which limit its integration in the system. An accurate forecasting of solar power generation is essential and significant in order to optimize the operation and maintenance (O&M) schedules to manage the O&M activities properly as appropriate. Due to the uncertain nature of power output, accurate forecasting of power generation is very important in economic perspectives too. Solar power generation depends on various factors hence the necessity to forecast production is more critical. Due to PV power output showcase variability at all timescales, it is challenging and difficult to do predictions and forecasts accurately.
Solar PV generation forecast is simply based on solar irradiance which a particular location is receiving. PV production forecasting is mainly affected by the variability of the meteorological and climatological conditions which are varying throughout the day.
Forecasting can be done referring to a single PV system or to the aggregation of a number of solar PV systems spread over an extended geographic area. Forecasts can be focused either on the output power of solar systems or on its rate of change which is called as ramp rate. Accordingly, different forecasting methods are available. Forecasting methods also depend on the mechanisms and information available such as data from weather stations and satellites, PV system statistical data and results from numerical weather prediction (NWP) models.
Forecasting methods can be broadly classified as physical or statistical. The physical methods of forecasting use solar PV models to generate PV forecasts while the statistical methods are basically based on past data to train models which are having only a little or zero dependency on solar PV models.
Two basic methods of forecasting are in presence when considering intra – day forecasts. First approach is used for short-term (up to 6 hours) forecasts and the other is for the prediction of future generation from a solar power plant for a day or less than a day. Solar PV forecasting is more critical and challenging when it comes to day‐ahead forecasting which output power generated by PV systems within an area is forecasted for each hour of the next day or even up to few days ahead.
Variety of resources are used to perform solar PV forecasts which range from measured weather and PV system data to satellite and sky imagery observations of clouds, to numerical weather prediction (NWP) models that introduce modern weather forecasting.
It is very significant to review about the accuracy of the results of the forecasting. Possible maximum achievable accuracy is determined mainly by the factors such as local climate and weather conditions, single site or regional forecast, forecast horizon and accuracy metric used.
After analyzing all the forecasting approaches, the practical experience shows that the best method for predicting the solar PV power generation is to combine the forecasts obtained from different models of numerical weather forecasting. Thus, it is a fact that accurate forecasting leads more economically viable and reliable delivery of electrical energy to the consumers.
References
[1] Wang, Guochang, Yan Su, and Lianjie Shu. “One-day-ahead daily power forecasting of photovoltaic systems based on partial functional linear regression models.” Renewable Energy 96 (2016)
[2] Report IEA PVPS T14‐01:2013
[3] Seul-Gi Kim, Jae-Yoon Jung and Min Kyu Sim, Department of Industrial & Management Systems Engineering, Kyung Hee University, 1732 Deogyeong-daero, Giheung-gu, Yonginsi, Gyenggi-do 17104, Korea
[4] avenston.com
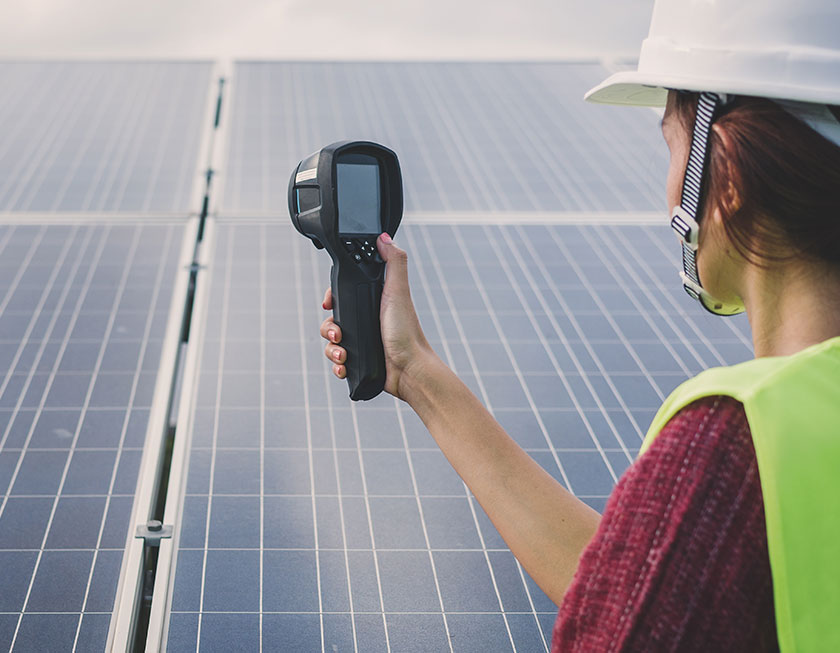
Plant Audit is a service designed and developed around the requirement to identify, record and locate the primary source of anomalies. It is requested for Photovoltaic power plants to stick to a range of strict guidelines, regulations and safety standards. The installation of a photovoltaic power plant is carried out to the precise specifications and meets all existing standards and regulations. it can be ensured by quality inspection services for PV plants.
System Quality Audit is useful to; verify that the installation of a plant has been carried out according to the precise specifications, comply with a range of international standards including IEC 62446 and IEC 60364-7-712 and assure the relevant authorities that a photovoltaic power plant is operating safely and according to the relevant local guidelines.
It is imperative to study the active performance of the system in reference with designed energy output to understand the health of the plant because it achieves optimum generation and maintain a higher performance ratio. Plant Audit Scan assists in determining the root cause of decline in generation, accelerated degradation of modules, frequent equipment breakdowns, abrasion of structures among many other activities and recommend necessary corrective actions. Thorough inspection ensures that the plant cohere to quality installation, code compliance and conformance to design and safety criteria.
Plant Audit service encloses all segments of the project from review of design and engineering drawings, to visual checks of the equipment and materials, running specialized tests at site on individual components like thermography and IV-Curve test on modules, verifying O&M records, understanding the fault patterns and spare part consumption. Furthermore, to in-depth review of the condition of the equipment to test critical components and measure key plant performance indicators, advanced tools and techniques can be used. A techno-commercial analysis is derived to evaluate the true-life expectancy of the plant and highlight the investment risk based on the audit report.
Better performance of Solar PV power plants is essential in terms of escalated revenue generation to the asset owner. The performance audit of the plants on regular interval will indicate the space for performance improvements on continuous basis as the saying goes “you can’t manage what you can’t measure “.
References
[1]. https://www.eprmagazine.com/green-zone, Oct.2020
[2]. https://www.sgs.com/en/energy/energy-sources, Oct.2020
[3]. https://solarpost.in/technology, Oct.2020
Lanka Property Show 2020 29th February to 1st March 2020 From 10am to 8pm At the Balmoral-Ballroom, Kingsbury Hotel.Lanka Property Show 2020 aims to bring together the Sri Lankan Property Developers, High End Real Estate Agents, HNWIs, Private and Corporate Investors, CEOs, Industry leaders, experts and professionals all under one roof for two exciting days.
WETEX 2019 is the leading global Water, Energy, Technology and Environment Exhibition, organised by DEWA, since 1999, under the guidance of HH Sheikh Mohammed bin Rashid Al Maktoum, Vice President and Prime Minister of the United Arab Emirates and Ruler of Dubai, and under the Patronage of HH Sheikh Hamdan bin Rashid Al Maktoum, Deputy Ruler of Dubai, Minister of Finance of the UAE and President of DEWA, in line with Dubai’s vision to build a sustainable future.
The largest and only Engineering and Technology exhibition in Sri Lanka “Techno 2019” organised by the Institution of Engineers Sri Lanka (IESL) is scheduled from the 11th, 12th and 13th October 2019 at the BMICH.
Get free professional consultation and special discounts this avurudu season from Sri Lanka’s premier solar energy solutions provider JLanka Technologies. All you have to do is simply fill out the form linked below and we will take care of the rest.

Every day, our Sun reports for its duty conscientiously. It rises in the East and wake us up from the bed. It works for about 12 hours a day and then sets in the West reminding us to find the bed and sleep in the night. This has been its daily routine for billions of years.
What if the Sun did not rise?
Hmmm!
It is a thought-provoking question. Isn’t it?
We would not have an extraordinary experience on the very first night even if the Sun didn’t rise. But how would we feel the daytime on the following day? It would be the very first daytime buried in the dark. Owls will be so busy with the order of the day, shouting all day long.
Hereafter…
There would be no luminous daytime. Only dark nights and dark days.
We would witness no evaporation, no winds, no waves, no cyclones, no rains …
What else would happen?
Yes. A lot of things…
Plants will stop producing food and they will no longer bear fruits. This will lead to a famine and mass extinction. No doubt. The final result will be a dead planet with no living beings.
We all are indebted to our Sun for what it has been doing. The chronicle about life on the Earth totally relies on the unrivaled service of the Sun. It illuminates our planet and helps our eyes view the world around us. Not only that our Sun is what keeps our planet worm making it an inhabitable place. Feeding numerous energy-consuming processes like photosynthesis, it plays a vital role on the Earth. Maybe that’s what our ancestors motivated to worship the sun god or solar deity. Today, our Sun has been assigned an additional but important job: To generate electricity with the help of solar PVs.
Nothing to explain. We have no access to the free service of Sun during the night. Just like you, solar PVs stop working and go to sleep in the night.
The glorious side of solar PVs is well known and not needed to magnify. To illustrate, the contribution of solar electricity to the German electricity supply was 0.3% and 6.6% in 2007 and 2017, respectively [1]. In other words, German cumulative solar PV capacity was 42 GW in 2017 [2]. It is enough to shut down as many as 84 coal-fired power plants each with 500 MW of capacity. This mind-blowing development manifests the power of solar PVs and encouraging other nations to replace coal, oil and gas with solar.
Today, almost all the nations are engaging in a constructive dialogue to solve the energy crisis, and detrimental consequences of climate change, and environmental pollution. Governments are belligerently encouraging the utility customers and private companies introducing various incentives and rebates, to invest in solar PVs. We have never seen such keenness before. Unfortunately, solar PV technology is still discriminated by some opponents. They highlight some technical challenges in solar PV technology and speak well of fossil fuels.
Nothing to argue. Like in any other technology, solar PV technology is confronted with some technical difficulties. The biggest challenge is that solar PVs cannot generate enough power under cloudy skies. And they cannot generate electricity during the night at all. This is the saddest side of solar PVs.
These challenges pose a serious question…
How do we meet the electricity demand with solar PVs after the sunset?
Well…
Today, we are heading straight for a 100% renewable energy or at least vow to replace fossil fuels with renewables. And solar PV is the best way to exploit energy from sunlight. In order to achieve our solar goals, we want our solar PVs to supply electricity even in the night and also under cloudy skies. This requires our Sun to reverse its old-fashioned journey and emerge in the West shinning in the night sky. But this will never happen!
What if we could mount a shining star in the sky to turn the darkness in the night away from us?
Yes. Pumped hydro is such an amazing idea which is not a star but still can act as a virtual Sun in the night sky!
The idea is straightforward. Following are some basic facts that highlight the need for energy storage in achieving our renewable energy targets.
Grid energy storage becomes an essential component when we are extensively dealing with solar electricity as solar PVs are unable to power your home in the night. Various energy storage technologies have been developed such as batteries (Li-ion, NaS, lead acid,), flywheel, superconducting magnetic energy storage (SMES), compressed air, and pumped hydro. However, neither flywheel nor SMES has shown to be appropriate for large-scale energy storage. Batteries are already being used even in MW-scale but are expensive.
While both compressed air and pumped hydro are being used in grid energy storage, pumped hydro has shown to be the best grid energy storage technology. It is a cost-effective, technology and can come online very quickly to respond to the variation in supply-demand. Once built, pumped hydro plants can serve for decades. Therefore, pumped hydro has become the most popular grid energy storage technology.
How do pumped hydro plants work? Let us explore more about this topic in the next article.
Reference
[1] Smolen, J., & Dudic, B. (2018). Electricity Price and Demand Pattern Changes Due to Increases in Solar Generation in German Electricity Markets. International Journal of Energy Economics and Policy, 9 (1), 168-173.
[2] Feldman, D. J., Margolis, R. M., & Hoskins, J. (2018). Q4 2017/Q1 2018 Solar Industry Update (No. NREL/PR-6A20-71493). National Renewable Energy Lab. (NREL), Golden, CO (United States).
[3] Hu, A., Levis, S., Meehl, G. A., Han, W., Washington, W. M., Oleson, K. W., and Strand, W. G. (2016). Impact of solar panels on global climate. Nature Climate Change, 6 (3), 290-294.
[4] Jacobson, M. Z., and Delucchi, M. A. (2009). A path to sustainable energy by 2030. Scientific American, 301 (5), 58-65.
Ctd
In the previous article, we discussed two decisive factors that should be taken into consideration when we are buying a solar PV system. Let’s continue our discussion. Which is the best PV technology?
We may have to evaluate dozens of factors prior to making a decision, but having said that, capital cost is of paramount importance as no significant difference in the performance or lifespan between two PV technologies could be observed.
What does it mean?
Ten to one the cheapest product may be the most preferred in a typical case where all other factors have been shown to have a minor impact on the final decision you are going to make!
So, what is the cheapest panel type?
The Czochralski process which is used to produce s-Si results in a huge amount of waste silicon. Further, the manufacturing process of s-Si solar PVs involves a number of complicated, energy-intensive steps. Unlike the s-Si PV manufacturing process, the process used to fabricate pc-Si PV is relatively straightforward and less energy intensive. And it generates less amount of waste silicon. So, pc-Si PVs are involuntarily cheaper than s-Si PVs even though we want s-Si PVs to be the cheapest as they are the most efficient.
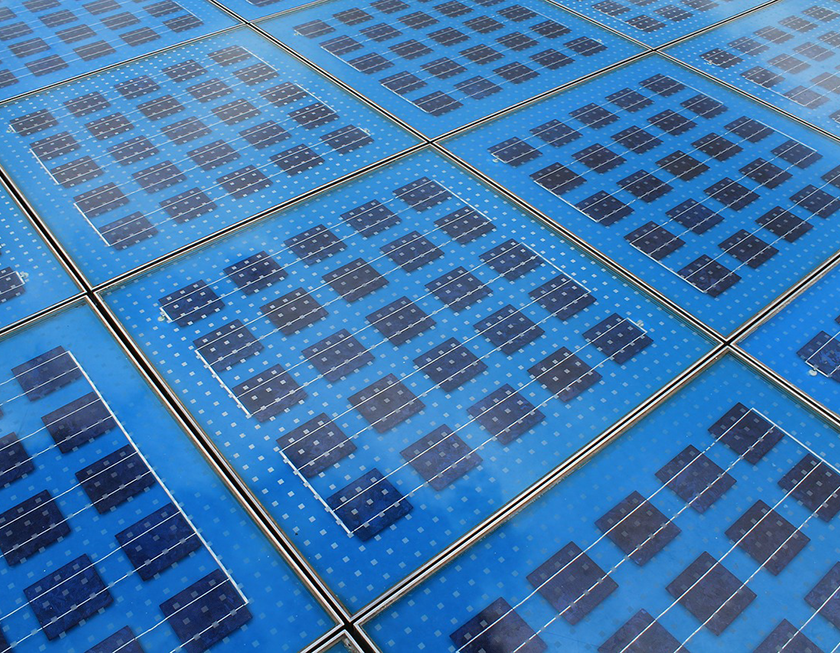
pc-Si solar PVs have a speckled blue color and an irregular look. As such, they are less aesthetically pleasing than mono crystalline silicon and thin film solar PVs. Some people, indeed, hate their miserable look whilst some others do not concern on it at all. s-Si solar PVs, on the other hand, appear black in color and have a regular, aesthetically pleasing look.
This explanation is just to have a simple idea about how to choose the best panel type. First, let’s take a look at the following table. It summarizes what we discussed above.
Table 01: Key upsides and downsides of s-Si and pc-Si solar PV technologies
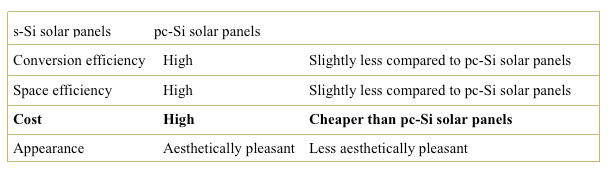
Relatively speaking, s-Si solar panels tend to be more efficient at converting solar energy into electricity and as such, they require less amount of space. Not only that s-Si solar panels do not annoy your eyes or mind though pc-Si solar panels are quite aesthetically unpleasant. However, the dark side of s-Si solar panels is that they are expensive than the pc-Si rivals. This is what is hindering the growth of s-Si solar PV market share and what is behind the large market share of pc-Si solar PVs. The cheaper pc-Si PV technology allows us to install more panels than s-Si panels for the same investment. This nicely outweighs the main drawback of pc-Si solar panels: Being less efficient than s-Si solar panels.
Now we have a rough idea of how to choose the best solar panel type. Taking all above-discussed facts into consideration, we can make followings general recommendations.
Keep in mind!
Before we come to the final decision, we need to weigh the impact of each key factor and some features pertaining to two PV technologies. In addition, your specific requirements must be given a hearing and the site needs to be inspected by an expert in the field. But these facts should not keep you up in the night. Ask your installer for technical assistance and site-inspection. They are always ready to help you find the best choice for you.

Simply connect it to your existing power supply… and reduce the amount of electricity you pay for, by converting sunlight on your roof to power the appliances you use everyday.

Are you thinking of buying a solar PV system? If so, you may have several factors that need to be taken into account. Needless to say, we would be in a dilemma whenever we have two or more options. So, you might also be in a dilemma over how to decide the right tech as we have two commercially viable crystalline PV technologies: s-Si and pc-Si. It is not prudent to make an immediate decision and go forward. All your personal requirements must be evaluated and your site needs to be inspected by an expert. Further, any prerequisite pertaining to your site has to be identified by a PV expert. This article is to help you evaluate some crucial variables you would find when choosing the best crystalline PV technology for your particular requirement.
Let’s start this discussion with the upsides and downsides of both technologies and then we will see how to make a wise decision.
Take a look at the table below. You can see that s-Si PV is the oldest version of commercial PV technology.
Table 01: Technological maturity of different PV technologies [1]
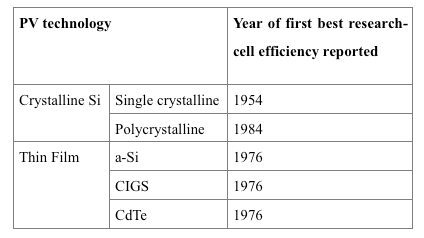
s-Si PV technology is almost three decades elder than pc-Si PV technology. As the most matured PV technology, s-Si solar PV technology has reached a technological zenith approaching its maximum obtainable efficiency limit [2]. And we know, people have enjoyed long-lasting, superior performance of s-Si PVs during the past. Besides the technological maturity, single crystalline silicon appears to be an is an intrinsically ideal material for making efficient solar PVs.
Why?
In s-Si solar cells, electrons feel less resistance to move within the cell as each s-Si solar cell is made of single crystals. Less resistance means more efficient!
Electrons in pc-Si solar cells, on the other hand, experience less freedom to move since each pc-Si solar cell consists of many crystals. Less freedom for electrons means high resistance and thus less-efficient! So, pc-Si solar cells are less efficient than their single crystalline counterparts as we can observe in table 2.
Table 2: Performance of commercial solar PV technologies [3]
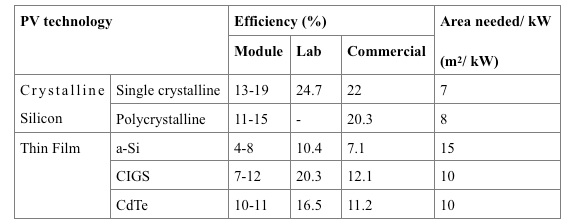
To illustrate above point, a study carried out by LONGi Green Energy Technology (formerly Xi’an LONGi Silicon Materials Corporation) has shown that monocrystalline solar power plants yield 5%-7% more power output than their polycrystalline silicon counterparts under the same conditions [4].
s-Si solar cells require less space than the space required by pc-Si solar PVs to generate the same electrical power since s-Si solar PVs are more efficient at converting sunlight into electricity. Take a look at table 2. You can realize how space-efficient s-Si solar PVs are. As shown in the table, s-Si solar panels require merely 7 m2 of area per kW whereas 8 m2 of area is needed for pc-Si solar panels per kW.
If you have limited space, it would probably be wise to come down in favor of s-Si solar PVs.
Reference
[1] Lacerda, J. S., & van den Bergh, J. C. (2016). Diversity in solar photovoltaic energy: Implications for innovation and policy. Renewable and Sustainable Energy Reviews, 54, 331-340.
[2] Geisthardt, R. M., Topič, M., & Sites, J. R. (2015). Status and potential of CdTe solar-cell efficiency. IEEE Journal of photovoltaics, 5(4), 1217-1221.
[3] Islam MR, Rahman F, Xu W (2016) Introduction, advances in solar photovoltaic power plant. Springer-Verlag, Berlin Heidelberg, pp 1–6
[4] Deng, H., Fu, N., Liu, P., Wu, G., Wang, F., Luo, C., & Deng, L. (2015, March). High-performance monocrystalline silicon could lead the photovoltaic power generation in the future. In Semiconductor Technology International Conference (CSTIC), 2015 China (pp. 1-3). IEEE.
Ctd

Solar PV is an ever-evolving, ever-changing technology where researchers keep improving the light-harvesting efficiency. Researchers have also been developing new species of solar PV with the intention of making more cost-effective, environmental benign solar PVs. Hundreds of different solar PV technologies have already been developed. However, only crystalline silicon (single crystalline and polycrystalline) and thin-film solar PV (CdTe, CIGS, a-Si) technologies meet the requirements needed for cost-effective, terrestrial-based electricity generation.
Crystalline silicon solar cells are incredibly long-lasting, cost-effective, environmentally friendly and reasonably efficient. So, crystalline silicon solar PV has become the most-demanding, highly remunerative PV technology with a market share of more than 90% [1]. While both s-Si and pc-Si solar panels are increasingly being manufactured, shipped and installed, they are competing with each other to protect and defend their place from the others in the fast-expanding PV market. Following pie charts clearly illustrates how these two technologies performed in the PV market in 2014 and 2007.
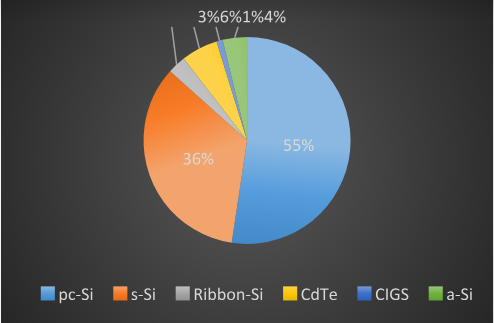
Figure 01: Market share by different PV technologies in 2007 [2]
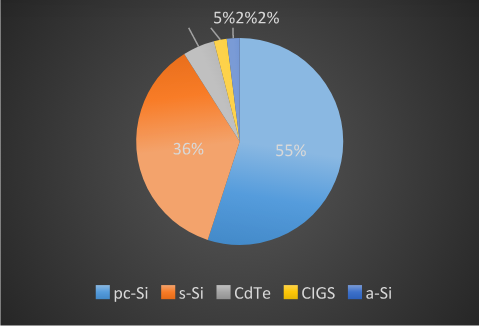
Figure 02: Market share by different PV technologies in 2014 [3]
The cumulative contribution of solar PV to global electricity generation increased to 0.9% in 2014 [3]. As can be seen in the above pie charts, both s-Si and pc-Si silicon PV technologies have been able to keep their market share nearly unchanged. However, the market share of a-Si solar PVs has shrunk from 4% to 2% whilst the market share of CIGS solar PVs has doubled from 1% to 2%. Further, the market share of CdTe solar PVs has narrowed down from 6% to 5% as a result of improving efficiency and the falling price of crystalline silicon PVs which led to an extensive demand for crystalline silicon PVs in the market.
Now let’s take a look at figure 03. It illustrates trends in the market share by PV technology in detail, observed from 1990 to 2013. Interestingly, ribbon-Si PV technology has been experiencing the worst trend. Its market share has been fluctuating and has almost vanished by 2012. Market share of s-Si PVs reached a low in 1997 and then gradually increased until 2000 to reach a peak. After 2000, the market share of pc-Si solar PVs has been expanding and outperforming all of its rivals.

Figure 03: Market share by different PV technologies from 1990 to 2013 [4]
s-Si solar PVs are more efficient than their pc-Si counterparts. But efficiency is just one factor one should give thought to before choosing a solar PV system. Capital cost, return on investment (ROI) and payback time, etc. are also crucial factors that we must take into account. Price of pc-Si solar PVs has declined sharply during the recent past, especially as a result of the immense Chinese contribution to the solar PV industry. Meanwhile, the efficiency of pc-Si solar PVs has been brought into an acceptable level making pc-Si solar PVs the most cost-effective, most dominant technology in the solar PV industry.
Reference
[1] Lunardi, M. M., Alvarez-Gaitan, J. P., Bilbao, J. I., & Corkish, R. (2018). A Review of Recycling Processes for Photovoltaic Modules. In Solar Panels and Photovoltaic Materials. IntechOpen.
[2] Tao, M. (2008). Inorganic photovoltaic solar cells: silicon and beyond. The Electrochemical Society Interface, 17(4), 30-35.
[3] Ramanujam, J., Verma, A., González-Díaz, B., Guerrero-Lemus, R., del Canizo, C., Garcia-Tabares, E. & Rath, J. (2016). Inorganic photovoltaics–planar and nanostructured devices. Progress in Materials Science, 82, 294-404.
[4] By Own work. – Fraunhofer ISE, Report, current editiondata from archived edition, July 28, 2014, page 18, Public Domain, https://commons.wikimedia.org/w/index.php?curid=35756530

Running for the 15th consecutive year, The Housing & Construction Expo “Build SL 2019” organized by the Chamber of Construction Industry Sri Lanka (CCI) will be held from the 22nd to 24th of March 2019, at the BMICH.
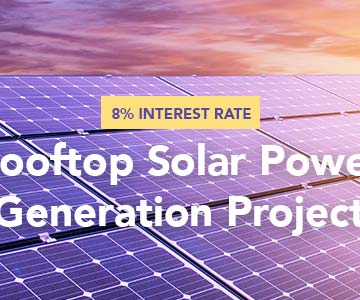
We are pleased to inform that a credit scheme to promote rooftop solar power generation systems has been established with preferential terms through financial assistance from Asian Development Bank (ADB). The credit line will be managed by the Ministry of Finance and Mass Media (MOFMM) and funds will be channeled to the beneficiaries through selected Participating Financial Institutions (PFI).
The foremost challenge in the crystalline silicon solar PV industry is to cheapen solar electricity. Manufacturers try to tackle this challenge by improving the efficiency and cutting down the module price.
One obvious approach to slash the cost of solar PV electricity is minimizing the number of light photons that escape from the cell without participating in the generation of electricity. We have already discussed two such strategies. Back reflector is another approach used to improve the efficiency by enhancing the internal reflectivity and promoting light trapping inside the cells.
The idea of back reflector is not new at all…
Crystalline silicon absorbs light and generates electron-hole pairs when light hits and shines on it. Electron-hole pairs then get separated leading to a photocurrent in a case of a short circuit and open-circuit voltage in a case of an open circuit. However, photons with energy less than 1.12 eV (bandgap of silicon) are not absorbed by the valance electrons as the valance electrons of silicon atoms need at least 1.12 eV of energy to jump on to its conduction band. As such, low-energy photons cannot generate electron-hole pairs. They just go through the lattice and escape.
What does it theoretically mean?
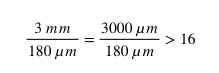
1.12 eV is equivalent to the energy of light photons whose wavelength is approximately 1100 nm. This implies that the photons with wavelengths longer than 1100 nm do not generate electron-hole pairs or a photocurrent in a cell. Further, it is worth noting that silicon is, of course, an excellent material for mass production of solar panels but it is not good at absorbing light or promoting its valance electrons to its conduction band since silicon is an indirect bandgap semiconductor material. Photon absorption and subsequent electron transition to the conduction band must, therefore, be assisted by phonons (discrete unit of vibrational energy in the lattice). Owing to this discouraging requirement, silicon atoms in the lattice miss a significant number of near-infrared light photons. These low-energy photons go through the cell and leave without getting absorbed. In particular, it has been observed that the penetration depth of the photons whose wavelengths range between 900-1100 nm is up to 3 mm whereas the typical thickness of silicon solar cells is about 180 µm! [1]
See the gap!
What does it imply?
The thickness of silicon wafers needs to be at least 16 times that of the wafers used in conventional solar cells in order to optimize the absorption of near-infrared light.
Inefficient light absorption has been one of the major barriers that hinder the development of efficient, low-cost solar PVs. In order to enhance the light absorption and efficiency, we need to use thick silicon wafers. Technology can endure the use of thick wafers but not the economy!
As we discussed in the previous articles, silicon wafers still account for about one half (51%) of the total cell price [2]. The thicker the wafer the greater the fabrication cost!
Two opposite requirements!
How to succeed in?
Even though fabrication cost falls with the decreasing wafer thickness, light absorption steadily drops with the decreasing wafer thickness. A wise way to address this complicated issue is to promote the light absorption capacity while keeping the wafer thickness at an affordable level.
Light absorption can be improved by employing some light management mechanisms that improve the internal reflection, minimize the rear side’s absorption, and enhance the light trapping capacity inside the cell. That is the idea of a back reflector. Light that is not absorbed by the cell reaches the back reflector and get reflected back. This increases the chance of unabsorbed photons getting absorbed by valance electrons leading to an increase in the photocurrent. Especially, when back reflector joins with the textured front surface, it forms an excellent light trapping scheme in which previously unabsorbed photons bounce back and forth between the back reflector and textured front surface [3]. Most of the unabsorbed photons bounce back and forth several times until they get absorbed by an electron. This notably extends the optical path length of the cell while keeping the geometric length of the cell the same. In other words, the light trapping schemes virtually widen the wafer thickness which is the most expensive component of a typical solar cell. An excellent model to lift the conversion efficiency whilst cutting the amount of crystalline silicon and the fabrication cost!
Screen printed silver and aluminium paste is still being widely used as the rear side metallization technique to create back contact in the solar PV industry. The screen-printed paste is then fired to obtain the back surface field passivation (BSF). The back contact adds structural strength, seals off rear side of the cell and act as a conductor. Not only that but also it acts as a back reflector and closely work with the textured front surface to trap light inside. But any technology has its own limits and restrictions. It is a universal rule. Al-BSF technology has also a technical limit in improving efficiency. The tireless effort to find more-efficient alternatives to the Al-BSF technology has given rise a wide range of new solar PV species with higher efficiencies. PERC is one of the best alternatives to Al-BSF technology. It has already been able to commercialize with an efficiency enhancement of about 1% thanks to its superior performance.
Today, BSF technology leads the solar PV market with the highest market share. However, its share would probably drop to about 50% by 2020 and would be less than 10% by 2028 as per recent estimations. This would be largely due to the increasing penetration of more-efficient new PV technologies such as PERC, PERL, and PERT into the PV market. [4] In addition, HIT and back contact solar PV technologies seem to be another efficient PV technologies competing in the market. All these technologies would finally, offer increasingly improved efficiency while cutting down the wafer thickness and the module price making the solar PV the most affordable energy technology.
Reference
[1] Eisenlohr, J., Benick, J., Peters, M., Bläsi, B., Goldschmidt, J. C., & Hermle, M. (2014). Hexagonal sphere gratings for enhanced light trapping in crystalline silicon solar cells. Optics express, 22 (101), A111-A119.
[2] Solanki, C. S., & Singh, H. K. (2017). Anti-reflection and Light Trapping in c-Si Solar Cells. Springer.
[3] Blakers, A. W., Wang, A., Milne, A. M., Zhao, J., & Green, M. A. (1989). 22.8% efficient silicon solar cell. Applied Physics Letters, 55 (13), 1363-1365.
[4] Fischer, M., Cells, H, Q. (2018). Trends & challenges in c-Si PV-an update of the ITRPV 9th edition. World solar congress-Shanghai.

As we realized in the previous article, crystalline silicon is not good at absorbing light efficiently. It is highly reflective and thus it losses a considerable portion of incident sunlight. In order for us to minimize the reflective loss and thus to raise the light absorption and efficiency of the cell, we need to tone down the reflectivity as much as possible. Use of anti-reflective coatings is an effective strategy but is not sufficient enough to make silicon solar PVs more efficient. Surface texturing (Textured front-side) is another attractive approach used to reduce the reflective loss with or without an anti-reflective coating. It makes the surface rougher leaving anti-reflecting features on the surface. The shape of the features may be square pyramids, pillars, or cones [1].
It is observable that any rough surface reduces the reflective loss by redirecting a great deal of reflected light back towards the cell with the help of anti-reflecting features on the surface. Unlike in a smooth surface, a textured surface, therefore, exhibits excellent light trapping properties and low reflective loss. Obviously, low reflective loss and improved light trapping capacity means high penetration of sunlight on to the solar cell. Also, increase in the path length of light inside the cell boosts the probability that the free electrons in the lattice capture light photons to jump on to the conduction band. As a consequence, both of these phenomena enhance the short-circuit photocurrent, and open-circuit-voltage of the cell leading to improved overall efficiency.
Various techniques such as photolithography, reactive ion etching, and laser texturing have been developed for surface texturing [2]. Today, alkaline texturing is widely being used for monocrystalline silicon solar cells. This etching process leaves randomly sized, distributed, square pyramid-shaped features as it is an anisotropic process. Since alkali surface texturing is anisotropic, it is not suitable for the texturing of polycrystalline silicon solar cells that consist of many randomly oriented grains. Therefore, acid-based isotropic wet etching techniques are used for texturing of polycrystalline silicon solar cells [3].
Texturing techniques have also been evolving with solar photovoltaic technology. While 30% of incoming solar radiation is reflected into the surrounding air by the surface of a polished silicon wafer, it can be reduced to about 15% even without an anti-reflective coating [1]. Some texturing processes have been reported to bring down the reflectance to about 10% and even less than 5% for multicrystalline silicon solar PVs with the assistance of silver etchants.
Power of texturing is observable, proven and therefore, is unquestionable. While texturing itself is capable of reducing the reflectance significantly, it can be used along with anti-reflective coatings to further reduce the reflective loss leading to much efficient photovoltaics on your rooftop.
Reference
[1] Kelvii Wei, G. U. O. (2017). Surface texturing for silicon solar energy by wet acid. J Nanosci Adv Tech, 2(1), 24-29.
[2] Do, K. S., Kang, M. G., Park, J. J., Kang, G. H., Myoung, J. M., & Song, H. E. (2013). Surface Texturing of Crystalline Silicon Solar Cell Using Silicon Nanowires. Japanese Journal of Applied Physics, 52(9R), 092301.
[3] Battaglia, C., Cuevas, A., & De Wolf, S. (2016). High-efficiency crystalline silicon solar cells: status and perspectives. Energy & Environmental Science, 9(5), 1552-1576.
Ctd

A solar cell is a sustainable factory built to produce solar electricity. It relies on nothing but sunlight which is one and only raw material it needed to generate electricity!
Just like any other factory does, solar cells need more raw material in order to produce more. The greater the solar intensity received the greater the solar power they generate. Traditionally, three different strategies are employed to raise the number of light photons that participate in the generation of electricity: Anti-reflective coatings, textured front-sides, and metallic back reflectors. They are all straightforward concepts. But their individual contribution in the operation cannot be underestimated at all. Let us see: Why?
Bare crystalline silicon solar cells reflect a substantial portion of incoming sunlight since pure crystalline silicon is highly shimmering. This results in low photocurrent and low module efficiency. The degree of reflectance may vary with the wavelength. This reflective effect reduces the number of light photons going through the front side on to the cell. On average, as much as 30% of IR and 50% of the UV portion is lost due to the reflection [1].
Is it possible to reduce the reflective loss to improve the light absorption capacity and efficiency of photovoltaics?
Yes! This is how the idea of an anti-reflective coating was born.
Reducing the reflection means increasing the number of photons transmitting on to the cell and increasing the overall efficiency. This is done by applying an anti-reflective coating. While various systems such as SiO2, TiO2, Al2O3, ZnO, ZnS, and Si3N4 have been proven to be anti-reflective, SiO2, Si3N4, and TiO2 are the most common materials being used in the industry [1, 2, 3].
Without anti-reflective coatings, solar PVs would not be economically viable. Moreover, it has been demonstrated that the reflective loss can more efficiently be reduced by applying a double layer anti-reflective coating. An efficiency enhancement of 214% and 60% have been reported with a double layer anti-reflective coating (SiO2/ TiO2) and with a single layer SiO2 coating as compared to as-grown silicon solar cells [1]. As it can be seen, the role of an anti-reflective coating is crucial to manufacture crystalline silicon solar cells at a lower cost with higher efficiency.
In next articles, we will see the duty, and significance of a textured front-side, and metallic back reflector in improving the efficiency.
Reference
[1] Ali, K., Khan, S. A., & Jafri, M. M. (2014). Effect of double layer (SiO2/TiO2) anti-reflective coating on silicon solar cells. Int. J. Electrochem. Sci, 9, 7865-7874.
[2] Al-Turk, S. (2011). Analytic Optimization Modeling of Anti-Reflection Coatings for Solar Cells (Doctoral dissertation).
[3] Du, Q. G., Alagappan, G., Dai, H., Demir, H. V., Yu, H. Y., Sun, X. W., & Kam, C. H. (2012). UV-blocking ZnO nanostructure anti-reflective coatings. Optics Communications, 285(13-14), 3238-3241.

As its name implies, polycrystalline silicon (multicrystalline silicon/ polysilicon) is made up of many small single crystals and is a form of silicon with high purity. So, polycrystalline silicon contains so many grains and also grain boundaries.
Polycrystalline ingots are grown in quartz crucibles which is then cut into square-shaped polycrystalline silicon substrates. Note that the manufacturing cost of solar cell modules includes the cost of silicon substrate (50%), module processing (30%) and cell processing (20%) [1]. As we can see it, the latter costs the least whilst the former costs as much as one half of the total cost. Therefore, the market price is largely determined by the cost of polycrystalline feedstock. This is why reducing the cost of silicon substrate remains one of the biggest changes in the PV industry. Any attempt to reduce the cost of silicon substrates is, in turn, an attempt to reduce the overall cost of solar PV modules and is an effort of expediting the growing share of solar electricity in the energy sector.
The cost of crystalline solar cells is constantly falling.
Anyway…
It is worth knowing that both single crystalline and polycrystalline solar PV technologies are already proven, economically viable means of converting solar radiation into electricity.
High purity silicon is too bad at conducting electricity as it is not a conductor but a semiconductor while the material needed to fabricate solar PVs must show some crucial properties like electrical conductivity. Simply, high purity crystalline is not a good candidate to be used as a light-harvesting semiconductor material in the solar PV industry.
Purity is good. But not here!
But… we are still not unlucky!
Even though high purity crystalline silicon is not originally conducting, we can make it conducting by introducing an insignificant amount of impurities like boron and phosphorus to the high purity crystalline silicon framework. This process is called doping by which extrinsic or doped silicon is formed. Although the amount of impurity is extremely negligible, it impressively improves the electronic, and optical properties needed for the semiconductor industry and plays a vital role in crystalline silicon solar cells.
There are two types of doping: p-type doing & n-type doping. P-type doping is done by introducing dopants with 3 valance electrons such as boron, aluminium and indium. Once they have been integrated into the lattice structure, p-type dopants catch an additional electron creating a hole (lack of an electron) in the valance band of silicon atoms. This increases the hole-concentration and in turn, the conductivity as well since the creation of holes makes the electrons in the valance band mobile. n-type doping is exactly the opposite of p-type doping. It is done by introducing elements with five valance electrons (phosphorous, arsenic, antimony) into the lattice. In this case, each dopant atom contains one more valance electrons than the silicon atoms. Four valance electrons of the dopant atoms combine with four electrons of the outer shell of silicon atoms. The additional electron of the dopant is loosely bounded to the positively charged nuclei and thus free to move and acts as charge carriers. Especially, they require much less amount of photon energy in order to promote to the conduction band (compared to the energy required by intrinsic silicon). This greatly enhances the light-absorbing capacity of the material and thus the efficiency when doped semiconducting material is used to manufacture solar cells.
Reference
[1] Dalapati, G. K., Masudy-Panah, S., Kumar, A., Tan, C. C., Tan, H. R., & Chi, D. (2015). Aluminium alloyed iron-silicide/silicon solar cells: A simple approach for low cost environmental-friendly photovoltaic technology. Scientific reports, 5, 17810.
Ctd
As we discussed in the previous article, single crystalline & polycrystalline silicon solar cells are made of single crystalline and polycrystalline silicon, respectively. Let us briefly discuss now how they are produced.
The crystalline silicon production process is an intermediate state between a small bear (sand/ quartz) and solar electricity.
Silicon which is the key raw material in crystalline silicon solar PV industry is extensively available in the form of silica (silicon dioxide) on and in the earth’s crust. But both monocrystalline and polycrystalline silicon solar cells require ultra-pure silicon which is not available in nature. So, silicon must be extracted from silica and then needs to be purified up to solar grade silicon.
Single crystalline silicon wafer:
Silicon is extracted from sand or quartz by heating with a reducing agent which is usually high purity coke or coal. In this process, an excessive amount of silica is used to reduce the formation of silicon carbide. During the process, oxygen combines with carbon to produce carbon dioxide and escape from the furnace leaving molten silicon. Extracted silicon in this reaction is, about 99% pure which is, however, not pure enough for the fabrication of solar cells. It needs to be purified further to obtain solar grade silicon. Today, chemical purification techniques are widely used for the purification process.
The next step is to obtain cylindrical ingots of high purity silicon. While several methods are available to grow single crystalline silicon, Czochralski process is widely used due to its intrinsic advantages over other techniques. First, ingots are obtained through the Czochralski method and then are sliced into silicon wafers using a diamond saw. The good fact about this process is that it is more advantageous than other techniques. The bad fact is that this process leaves a great deal of waste silicon. The amount of waste silicon depends on the shape of the wafer being produced. Approximately one-half of silicon is wasted if the wafer is going to be circular-shaped. But it becomes notably high if the ingot is cut into the rectangular shape or hexagonal shape. This wastage is overwhelming since the process of making silicon ingots consumes a huge amount of energy thereby increasing the overall cost of the final product. This is one of the strongest stumbling blocks which hinders fabrication of low-cost s-Si solar cells.
Anyway, as its name implies, single crystalline silicon is made of a single crystal. The entire sample is made of an unbroken, high purity single crystal of silicon. Hence, single crystalline silicon contains no grains or grain boundaries.
s-Si solar cells are more efficient than pc-Si solar cells
Recombination mechanisms which reduce the photocurrent and thus the efficiency of a solar cell occur more frequently at grain boundaries. Also, electrons experience less freedom to move when there are many grains. Since s-Si contains neither grains nor grain boundaries s-Si solar cells are more efficient than their pc-Si counterparts.
Ctd
Nobody will have a comfortable life in an oven-like world.
Nobody is willing to live in a sandy desert.
Nobody would like to die in a heat wave.
Nobody would be healthy in a severely contaminated world.
As we discussed in our very first articles, anthropogenic climate change which fueled by the extensive use of fossil fuels is creating an environmental catastrophe which is now turning to be life-threatening to our mother Earth.
We are now in the vicinity of a horrendous tragedy.
We just started reaching it at a snail’s pace with the industrial revolution. Blindly, we are now making an all-out effort to reach it in the name of development. Intensified cyclones, sea level rise, desertification, frequent floods, droughts, and many other extreme weather conditions signpost a devastating disaster. All these terrible disaster-carriers are asking us to take appropriate actions.
If we really want to decelerate the deadly change in the climate system and alleviate its evil effects, we must shift to potential alternative energy technologies ASAP.
Solar energy is the best thirst-quencher to slake our excessive thirst for energy.
Naturally, no green technology would be attracted by the general public unless it is affordable, efficient, stable, durable, and environmentally friendly. Therefore, unattractive green technology would not have a far-reaching impact on the environment or economy.
Crystalline silicon solar PV is such amazing technology that carries all these salient characteristics and therefore, it has become the fastest-growing technology used to harvest energy from the tireless Sun’s radiation. They are increasingly affordable and soundly efficient at converting sunlight into electricity and, what’s more, they reach us with a limited performance warranty of about 25 years plus with a limited product warranty of about 10 years.
So,
Being a proven and potential technology, crystalline silicon solar PV is our plan A to replace fossil fuels and solve the maturing energy crisis/ climate change. There is currently no plan B…
And nobody knows if there will be…
So…
It is time to discuss the crystalline silicon PV technology in details. First, we will briefly discuss two most prominent crystalline silicon solar PV technologies. Then we will discuss the pros and cons of both technologies and finally, we will move on to discuss how to decide the best technology that fits one’s specific requirements.
Appearance:
The big brother in the solar PV industry, single crystalline silicon solar cells can easily be distinguished from polycrystalline silicon solar cells. They are moderately circular-shaped whereas polycrystalline silicon solar cells are rectangular-shaped. Also, they can easily be distinguished by the color. Single crystalline silicon solar cells appear black in color due to the way sunlight interacts with the single crystalline silicon layer. Polycrystalline silicon solar cells, on the other hand, are blue in color. This is largely due to the effect of anti-reflecting coating which used to improve the light absorption and light-to-electricity conversion efficiency.
Key raw material used:
Crystalline silicon is the key raw material in both technologies. However, as their names imply, single crystalline and polycrystalline silicon solar cells are made of single crystalline silicon (s-Si) and polycrystalline silicon (pc-Si), respectively.
Ctd

As the leading solar power provider in Sri Lanka, JLanka Technologies is proud to represent it’s self with it’s latest innovative technology yet again at the Jaffna International Trade Fair considered as the most comprehensive and focused exhibitions held in the North.
Now with Trinahome PV solution system you have the option to transform your own residential rooftop into an electrical power generation platform which would supply the household electrical load. This complete solution consists of modules, inverter, grid-box, mounting structure and cables.
This fully integrated, all in one PV solution kit is an energy independent and cost effective solution for your home.
It is undoubted that solar photovoltaic is the most likely-looking green energy technology in the 21st century and is the best technology to exploit largely untouched idle energy source: Solar energy. It is having great potential for cutting fossil fuel consumption and harmful emissions. And it is armed with all the necessary tools and implements needed to reverse the fast-maturing change in the climate system. But… However, it is unfortunate that we have not yet been using it adequately.
To illustrate, take a look at the Following pie chart. It displays the world’s electricity generation in 2015, by energy sources.
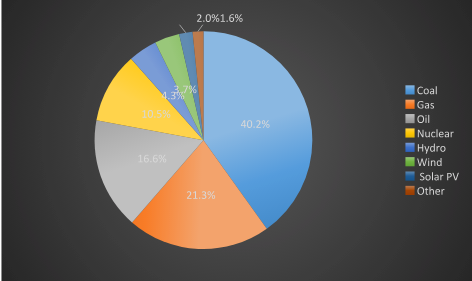
Figure 01: World electricity generation by source in 2015 [1]
The cumulative electricity generation in 2015 was 24 310 TWh. As illustrated by the chart, coal, gas and oil have generated 40.2%, 21.3%, and 4.3% of the electricity demand, respectively while solar PVs generated merely 2%. In a nutshell, almost 65.8% of electricity demand has been met by burning fossil fuels. It is 30 times greater than the solar electricity generation. What does it imply?
Assuming no change in the electricity demand, we need to double the solar electricity generation each year if we want to completely replace fossil fuels with solar electricity within five years (25= 32). Sound interesting!
But… Keep in mind!
Demand for electricity will never remain unchanged or will never be decreasing. It will be constantly increasing. Obviously!
So… As we can see it, we have a lot to do if we really want to make the Prussian blue, orange and yellow colored segments dark-blue colored! Of cause, wind and other renewable energy sources can also play a big role. But still… as the big brother in the renewable energy industry with the greatest energy potential, solar PV technology must shoulder the key responsibility.
So,
In order to cut fossil fuel consumption…
In order to reverse the greenhouse effect…
In order to fight against the climate change…actively, convincingly with enthusiasm…
We need to spread out solar PVs over the rooftops, across the regions, territories and the world. This requires manufacturing more and more solar PVs and thus needs a copious amount of raw materials. Simply, the raw materials need to be abundant in nature!
Silicon which is the key raw material in commercialized crystalline photovoltaic industry is such material available in the form of silicon dioxide in sand and quartz. And it is one of the most abundant elements in the Earth’s crust (29.5%) as we discussed earlier [2].
Silicon offers many other benefits over other semiconducting materials. Hazardous materials coming with electronic devices, pesticides, fossil fuels and, etc. causes a range of detrimental environmental effects and health problems whilst our planet has terribly been contaminated with a lot of toxic materials. Therefore, we should take every possible step to prevent the already stressed-earth from contaminating. Unlike many other photovoltaic materials, silicon is a non-toxic material which does not impose any known adverse effect on the environment or health. This property makes it an ideal material for mass production of solar PVs.
References
[1] Breyer, C., Bogdanov, D., Aghahosseini, A., Gulagi, A., Child, M., Oyewo, A. S. & Vainikka, P. (2017). Solar photovoltaics demand for the global energy transition in the power sector. Progress in Photovoltaics: Research and Applications.
[2] Yaroshevsky, A. A. (2006). Abundances of chemical elements in the Earth’s crust. Geochemistry International, 44 (1), 48-55.
Ctd

In the previous article, we realized that crystalline silicon solar cells were more realistic and cost-effective in commercial solar electricity generation compared to GaAs solar cells although crystalline silicon solar cells were less efficient than GaAs solar cells. In this article, we are going to discuss the biography of crystalline silicon solar cell technology and the latest trends in crystalline silicon cell industry.
Depending on the degree of crystallinity, we have a variety of silicon allotropes namely, single-crystalline silicon (s-Si), polycrystalline silicon (pc-Si), nanocrystalline silicon and amorphous silicon. While amorphous silicon and nanocrystalline silicon are used in thin film solar cell technologies (2nd generation solar cells), both pc-Si and s-Si are used to fabricate 1st generation crystalline silicon solar cells.
The first c-Si solar cell was developed by Bell laboratories in 1953 with an efficiency of 4.5 % and they improved the efficiency to 6% in 1954 [1, 2]. It was an impressive efficiency and amazing beginning at the time and astounded the scientific community all around the world attracting much attention from researchers leading to incredible advances in terms of $/W (system cost), $/kWh (cost of electricity), efficiency, and system durability.
Soon after the mind-blowing invention of efficient c-Si solar cells, researchers started to think of its potential applications and finally, they outmatched.
What did they focus on?
No…. They did not think of developing solar cells to pump water, to light up cities, or to keep the refrigerators cool but to power space satellites outside the Earth.
Nobody tried to install solar PVs on a house or factory.
Nobody invested in a solar PV park.
….as solar PV were too much expensive.
Anyway, growing interest urged to develop solar PVs for terrestrial applications. Sharp Solar was one of the frontrunners in research and development. It was founded as a subsidy of Sharp Electronics in 1959. Braking the ice, they started manufacturing commercial solar modules in 1964. Although it was not initially economical to illuminate a single village at night, the company could install solar panels on as many as 256 lighthouses by 1972. [3] And it showcased the potential of solar PV technology to be an alternative to black gold!
Oil embargo happened in 1973 was also a salutary blessing in the development of solar PV technology. As other companies like Sharp Solar and Phillips came into play, the price of solar modules started to drop dramatically.
Solar PVs are no longer big-tickets. They are now much affordable, as never before, even for average electricity customers who wish to make their energy bill zero or negative. Crystalline silicon solar cells are the most efficient solar PV technology available for commercial electricity generation purposes. They have never lost their battle to retain their influence in terrestrial solar PV applications. While crystalline solar cell technology has been dominating in the market, s-Si and pc-Si technologies have also been competing each other. It could be observed that pc-Si solar cells have outmaneuvered their s-Si twin brothers in the current market. s-Si solar cells represent only 33% of the current PV market while pc-Si solar cells make up 53% of the market [4]. Anyway, their cumulative contribution to the terrestrial solar PV market is remarkable and is about 86%. While two technologies are challenging each other, they are closely working together against climate change and the greenhouse effect. And both are now increasingly exerting an unprecedented pressure on the fossil fuel market leading to a downward trend in the fossil fuel prices.
References
[1] G. L. Pearson, 18th IEEE Photovoltaic Specialists Conference, PV founders award luncheon (1985).
[2] D. M. Chapin , C. S. Fuller , G. L. Pearson , J. Appl. Phys. 25 , 676 (1954).
[3] Green, M. A. (2005). Silicon photovoltaic modules: a brief history of the first 50 years. Progress in Photovoltaics: Research and applications, 13 (5), 447-455.
[4] Tao M. Inorganic Photovoltaic Solar Cells: silicon and beyond. The Electrochemical Society Interface 2008:30–5
Being an ever-evolving technology, solar photovoltaic technology has been giving birth to a number of different species of solar photovoltaics. The efficiency, durability, technical/ economic feasibility, payback time…. All depends on the type of solar cells.
Some are more efficient than others but not cost-effective. They are, of cause, ideal to power space satellites but not to offset your electricity bill. If used in terrestrial applications, it would cost an arm and a leg. Simply, they do not fit your rooftop or wallet. Out of hundreds, only a few types of photovoltaics have been commercialized because most of other PV technologies are still not technologically/ economically viable.
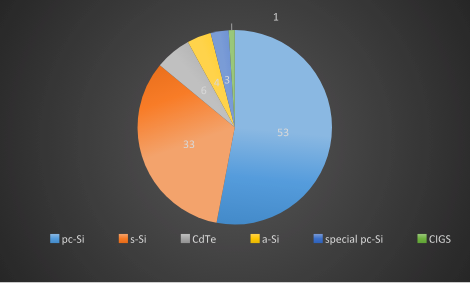
Figure 01: Market share (%) of different photovoltaic technologies in 2015 [1]
Above pie chart demonstrates the current market share of the most dominant photovoltaic technologies available in today’s market. As it can be seen, silicon-based solar photovoltaics make up almost 93% of the market whilst all other types of photovoltaics represent merely 7% of the market. No any other type of photovoltaics has come to win a minute or at least a second from the above chart!
Depending on the key materials used and level of commercial maturity of the technology, photovoltaic technologies are classified into three generations namely first, second, and third generations [2].
The first generation solar photovoltaics are well-matured in terms of their technology, and fabrication process. They represent the oldest commercially available photovoltaics technologies. Typically, they are made of either crystalline silicon (c-Si) or GaAs wafers.
GaAs is a direct bandgap semiconductor material with a bandgap of 1.43 eV at 300 K and exhibits remarkable optical properties compared to silicon. Silicon, on the other hand, is an indirect bandgap material whose bandgap is about 1.12 eV at 300 K [3]. Therefore, silicon solar cells require comparatively thicker silicon wafers in order to absorb incoming sunlight sufficiently.
Advantages of GaAs over c-Si
c-Si or GaAs solar cells?
It is true that GaAs solar cells offer unparalleled benefits with the highest conversion efficiency of any photovoltaic material [4]. But still…They have not yet been chosen for commercial solar electricity generation purposes.
Why?
What are the factors hindering the commercial terrestrial applications of GaAs solar cells?
Well
Firstly, the GaAs solar cell manufacturing process is much expensive. Secondly, GaAs is a an expensive material than silicon since gallium and arsenic are a very rare materials on the earth’s crust. Another key point is that mass production of GaAs solar cells requires more and more gallium/ arsenic. Note that natural abundance of Si, Ga and As are 29.5%, 0.0019% and 0.00017%, respectively [5]! It is a big challenge to maintain a continuous supply in large-scale since both gallium and arsenic are rare/ expensive materials. Following chart clearly explains how rare materials arsenic and gallium are.
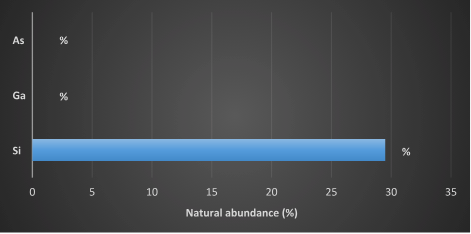
Figure 02: Natural abundance of Si, Ga and As [5]
Take a look at the above chart and see if you can observe any Ga or As.
You would see…
You can observe neither Ga nor As. You can observe Si, though.
It is evident that silicon is one of the most abundant element and thus is the best material for large-scale implementation. Moreover, arsenic has been identified to be a carcinogen. Inorganic arsenic (GaAs is partly dissociated in vivo into inorganic arsenic) can induce lung, skin, and bladder cancers [6]. In addition, it has been observed that arsenic is having a link with cardiac disorders, neurological diseases and even diabetes [7]. Some studies also suggest its relationships with some chronic diseases like acute kidney failure. Hence, large-scale implementation of GaAs solar cells might be a disaster unless they are not recycled properly after their end-of-life.
c-Si solar cells are less efficient than GaAs solar cells. But other advantages offered by c-Si solar cells far outweigh any drawbacks.
Will GaAs solar cells be cost-effective? If so, when?
Nobody knows.
Anyway… We know one important thing!
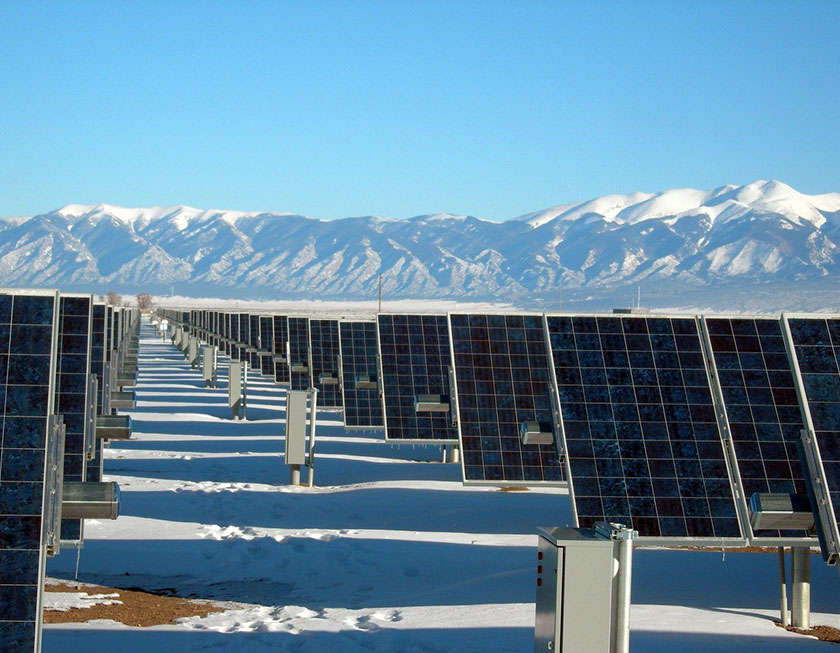
c-Si solar cell technology has already proven to be cost-effective even in some snowy countries. And it is a God’s gift for Sunbelt countries!
References
[1] Tao M. Inorganic Photovoltaic Solar Cells: silicon and beyond. The Electrochemical Society Interface 2008:30–5
[2] Ranabhat, Kiran, et al. “An introduction to solar cell technology.” Journal of Applied Engineering Science 14.4 (2016): 481-491.
[3] Sze, S. M., & Irvin, J. C. (1968). Resistivity, mobility and impurity levels in GaAs, Ge, and Si at 300 K. Solid-State Electronics, 11 (6), 599-602.
[4] Jean, J., Brown, P. R., Jaffe, R. L., Buonassisi, T., & Bulović, V. (2015). Pathways for solar photovoltaics. Energy & Environmental Science, 8 (4), 1200-1219.
[5] Yaroshevsky, A. A. (2006). Abundances of chemical elements in the Earth’s crust. Geochemistry International, 44 (1), 48-55.
[6] Omura, M., Tanaka, A., Hirata, M., Zhao, M., Makita, Y., Inoue, N., & Ishinishi, N. (1996). Testicular toxicity of gallium arsenide, indium arsenide, and arsenic oxide in rats by repetitive intratracheal instillation. Toxicological Sciences, 32 (1), 72-78.
[7] Hong, Y. S., Song, K. H., & Chung, J. Y. (2014). Health effects of chronic arsenic exposure. Journal of preventive medicine and public health, 47 (5), 245.

JLanka Technologies the pioneering solar energy provider in Sri Lanka claims yet another victory at the Techno Award Night, held on 2nd of November 2018 at the Galle Face Hotel. Graced by Chief Guest Eng. Kamal Amaraweea, JLanka Technologies claims two awards, the gold award presented for the stall with the best display & demonstration of engineering product and the merit award for the stall with the most innovative local engineering product.
In the previous article, we discussed the first-stage evolution of photovoltaic technology. It was the biography of photovoltaic technology before the beginning of the 21st century.
What happened in the 21st century?
It is interesting to know that the worldwide cumulative photovoltaic capacity merely stood at about 95 kW in 1968. It took almost three decades to reach 950 MW in 1998. The cumulative worldwide installation had been growing at a snail’s pace until about 2000 and reached a milestone of 1000 MW in 1999 [2]. Showing a green light for a greener world, the cumulative capacity which was about 8 GW in 2007, nearly doubled to hit 15 GW of capacity in 2008 [3]. Since then, the capacity started expanding swiftly, as it can be seen in the following table and column chart.
Table 01: Worldwide cumulative and added photovoltaic capacity [3]
|
Year |
2007 |
2008 |
2009 |
2010 |
2011 |
2012 |
2013 |
2014 |
2015 |
2016 |
2017 |
|
Added capacity (GW) |
2.5 |
6.6 |
8 |
17 |
31 |
29 |
38 |
40 |
51 |
76 |
98 |
|
Cumulative capacity (GW) |
8 |
15 |
23 |
40 |
70 |
100 |
137 |
177 |
228 |
303 |
402 |
According to above table, as much as 98 GW of solar photovoltaic capacity has been added in 2017 thereby raising the worldwide cumulative capacity to 402 GW which is now comparable with worldwide cumulative solar hot water capacity. Worldwide cumulative solar hot water capacity has grown by merely 16 GW and reached 472 GW in 2017. This reveals a continuous decline in annual growth whilst solar photovoltaic technology is showing an overwhelming progress. Following bar chart clearly illustrates how fast worldwide cumulative photovoltaic capacity has been growing during the recent past [3].
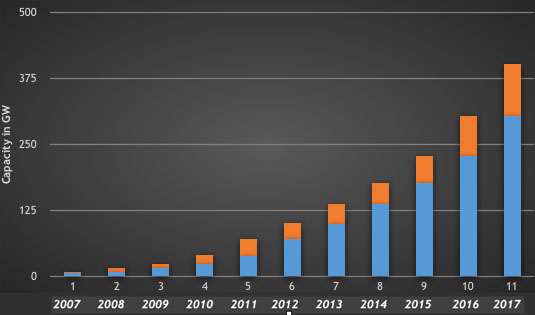
Figure 01: Worldwide cumulative and added photovoltaic capacity [3]
What is behind the boom?
As we can see it, the cumulative photovoltaic capacity has now been growing fast, but it was not until 1998 which seems to be a pivotal point in the photovoltaics’ history. What is behind the sudden increase in worldwide installations?
We can identify a lot of forces attempting to shift the world’s energy interest towards solar photovoltaics. Let us discuss some of the most vigorous forces.
Prior to the beginning of the 21st century, there was a lot of impedance to the commercialization of photovoltaic technology. It was too expensive for commercial implementations compared to fossil fuels and also other renewable energy technologies like hydropower, wind power, and concentrating solar thermal. Price of solar photovoltaic modules has been continuously falling and eventually, photovoltaics became economically viable and competitive with the fossil fuel prices. The continuous drop in the price is what made it the most popular and fastest-growing renewable energy technology in the 21st century. Price is forecast to drop further attracting more and more investments.
Even in the 1950s, people worried a lot about the possible detrimental effects of climate change. Fossil fuel burning was the main suspect. Not only scientific community, even government bodies and private organizations actively started fighting the climate change leading to many achievements such as the Kyoto protocol in which state parties committed reducing greenhouse gas emissions. The best way to did it was switching to renewable energy sources as soon as possible. Many countries introduced attractive renewable energy policies to promote solar PV and encourage the public to invest in solar PV. Thanks to such government support and falling price of solar PV, investing in solar PV has now become a win-win for each party involved in.
Our primary sources of energy, fossil fuels are rapidly depleting due to heavy consumption whilst price is increasing. This trend naturally forces to search for potential alternatives. Price of solar PV modules is already competitive with most of the other renewable energy technologies. Increasing price of fossil fuels, and rapid depletion of fossil fuels direct more attention towards photovoltaics.
Efficiency of solar photovoltaics is being improved day by day. A number of photovoltaic technologies have been developed with different efficiencies. Multi-junction concentrated solar cells offer the highest efficiencies but are too expensive. Single crystalline and polycrystalline silicon solar cells also offer reasonable efficiencies yet still are cost-effective than most of the other types of photovoltaics. Various state of the art technologies (Tandem solar cells, PERC, etc.) have already been employed successfully, leading to more efficient photovoltaics.
These unique features make solar photovoltaics an ideal alternative to depleting fossil fuels. There is now no any other type of renewable energy technology to compete with photovoltaics. In fact, there were several competitors in the past namely hydropower, concentrating solar thermal, and wind power. However, most of the potential hydropower sources are already being exploited and thus hydropower capacity has been reaching a plateau. Furthermore, when capital investment, space-efficiency, environmental impact, payback time, etc. are taken into consideration, photovoltaic technology is more practically viable than concentrating solar thermal, and wind power. It is not a rhapsody. Take a look at the following bar chart. It clearly depicts that solar photovoltaics was the fastest-growing renewable energy technology which added 98 GW of power in 2017. This is nearly twice the capacity added by wind power during the same year. Wind power, hydropower, bio power, and geothermal power have added 52 GW, 19 GW, 8 GW, and 1 GW of power, respectively, in 2017.
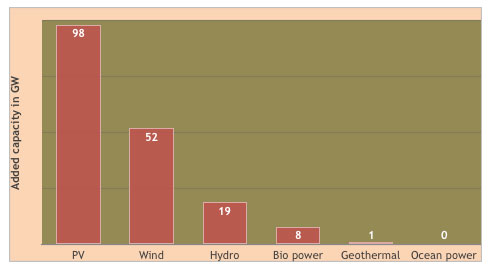
Figure 02: Capacity added by different renewable energy technologies in 2017 [3]
To sum up, photovoltaic technology has evolved to be a commercially viable and technically feasible technology capable of providing an unimaginable amount of energy to meet mankind’s energy demand, making the world greener and sustainable. With continuous research and development, it would continually be evolving and revolutionizing the world with impressive benefits.
It is real!
We are all witnesses!
References
[1] Harmon, C. (2000). Experience curves of photovoltaic technology.
[2] Guha, S. (2005, January). Can your roof provide your electrical needs?-the growth prospect of building-integrated photovoltaic. In Photovoltaic Specialists Conference, 2005. Conference Record of the Thirty-first IEEE (pp. 12-16). IEEE.
[3] REN21. 2018. Renewables 2018 Global Status Report (Paris: REN21 Secretariat).
In the previous article, we discussed how solar photovoltaics technology had been impressing the world with an unexpected growth in the cumulative capacity. It was evident that the concentrating solar thermal technology was being trampled by increasingly efficient photovoltaic technology.

How photovoltaic technology did it?
Well. Let us discuss in details.
First of all, we need to have a pretty good grasp on how photovoltaic technology has been evolving. Then it would be easy to understand how it succeeded in the energy industry.
Following is some historical milestones reached by the solar photovoltaic technology in the past.
Solar photovoltaic technology was too expensive for terrestrial applications even in the 1990s. Therefore, it was not used if grid electricity was available. However, the technology was quite technically feasible in remote locations where grid electricity was not available. Thanks to such applications, the cumulative solar photovoltaic capacity had been growing but only at a snail’s pace until beginning of the 21st century. Thereafter, the growth in the world’s cumulative photovoltaic capacity has been drawing an exponential line! This unexpected growth can be largely attributed to the increasing light-to electricity efficiency, cost reduction and also the increasing price of fossil fuels and environmental concerns over fossil fuel burning. In the next article, let us discuss how photovoltaic technology has been evolving from the end of the 20th century.
Reference
[1] Shah, A., Torres, P., Tscharner, R., Wyrsch, N., & Keppner, H. (1999). Photovoltaic technology: the case for thin-film solar cells. science, 285 (5428), 692-698.
[2] Jenkins, T. (2005). A brief history of… semiconductors. Physics education, 40 (5), 430.
[3] Bilal, M., Arbab, M. N., Afridi, M. Z. U. A., & Khattak, A. (2016). Increasing the Output Power and Efficiency of Solar Panel by Using Concentrator Photovoltaics (CPV). International Journal of Engineering Works, 3 (12), 98-102.
[4] Jean, J., Brown, P. R., Jaffe, R. L., Buonassisi, T., & Bulović, V. (2015). Pathways for solar photovoltaics. Energy & Environmental Science, 8 (4), 1200-1219.
[5] Lukanin, D., Kalaev, V., & Zhmakin, A. (2003, September). Parallel simulation of Czochralski crystal growth. In International Conference on Parallel Processing and Applied Mathematics (pp. 469-474). Springer, Berlin, Heidelberg.
[6] Raval, N., & Gupta, A. K. (2015). Historic Developments, Current Technologies and Potential of Nanotechnology to Develop Next Generation Solar Cells with Improved Efficiency. International Journal of Renewable Energy Development, 4 (2).
[7] Gupta, M., & Hasan, M. H. (2014). Design of a Large Effective Area Octagonal Photonic Crystal Fiber (Doctoral dissertation, East West University).
[8] Goetzberger, A., & Hebling, C. (2000). Photovoltaic materials, past, present, future. Solar energy materials and solar cells, 62 (1-2), 1-19.
[9] Nusbaumer, H. (2004). Alternative redox systems for the dye-sensitized solar cell.
[10] Meissner, D. (2013). Photovoltaics based on semiconductor powders. Materials and Processes for Energy: Communicating Current Research and Technological Developments.
[11] Fraas, L. M. (2014). History of solar cell development. In Low-Cost Solar Electric Power (pp. 1-12). Springer, Cham.
[12] Petrova-Koch, V. (2009). Milestones of solar conversion and photovoltaics. In High-Efficient Low-Cost Photovoltaics (pp. 1-5). Springer, Berlin, Heidelberg.
[13] 1962: The first telecommunication satellite, Telstar was launched by Bell telephone laboratories
[14] Hegedus, S. S., & Luque, A. (2003). Status, trends, challenges and the bright future of solar electricity from photovoltaics. Handbook of photovoltaic science and engineering, 1-43.
[15] Fraas, L. M. (2014). History of solar cell development. In Low-Cost Solar Electric Power (pp. 1-12). Springer, Cham.
[16] Rosenblum, Louis, et al. “Photovoltaic power systems for rural areas of developing countries.” Solar Cells 1.1 (1979): 65-79.
[17] Jewell, W. T. (1989). Electric utility experience with solar photovoltaic generation. IEEE Transactions on Energy Conversion, 4 (2), 166-171.
[18] Wang, A., Zhao, J., & Green, M. A. (1990). 24% efficient silicon solar cells. Applied physics letters, 57 (6), 602-604.
[19] Imamura, M. S. (1994). Grid-connected PV plants: field experiences in Germany and a pursuit of higher solar energy collection efficiency. Solar energy materials and solar cells, 35, 359-374.
[20] Kumavat, P. P., Sonar, P., & Dalal, D. S. (2017). An overview on basics of organic and dye sensitized solar cells, their mechanism and recent improvements. Renewable and Sustainable Energy Reviews, 78, 1262-1287.
[21] Friedman, D. J., Kurtz, S. R., Bertness, K. A., Kibbler, A. E., Kramer, C., Olson, J. M., & Snyder, J. K. (1995). Accelerated publication 30.2% efficient GaInP/GaAs monolithic two‐terminal tandem concentrator cell. Progress in Photovoltaics: Research and Applications, 3 (1), 47-50.

The largest and only Engineering and Technology exhibition in Sri Lanka “Techno 2018” organised by the Institution of Engineers Sri Lanka (IESL) is scheduled from the 12th to 14th of October 2018 at the BMICH from 10am to 8pm.

With numerous innovative solutions at Techno 2018, JLanka Technologies takes pride in sponsoring the book launch of “Energy Resources of Sri Lanka” held on 12th of October 2018 at the Techno 2018 Exhibition Seminar Room from 11am onwards. A project by the Mechanical engineering Sub Committee of the institution of Engineers Sri Lanka
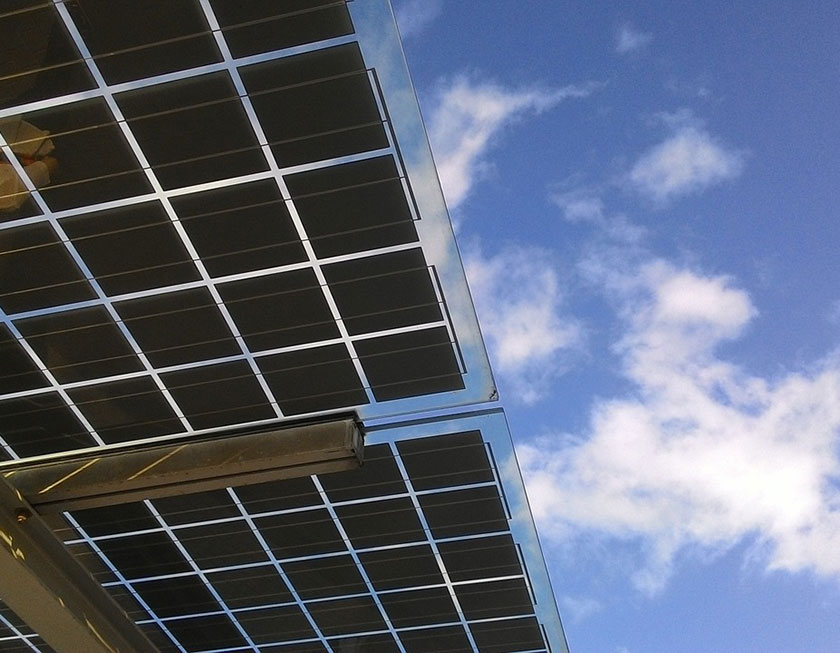
Both concentrating solar and solar photovoltaics could attract much attention during the energy crisis in the 1970s, triggered by the OPEC embargo in 1973. However, it was not until the early 2000s that solar photovoltaics had an appreciable grid-penetration. Concentrating solar power was the giant in the solar energy industry until the beginning of the 21st century. Anyhow, it could not maintain its glory all along the line. Solar photovoltaics started an outstanding and progressive journey. They just emerged as a little child and then started to compete with concentrating solar thermal technology, aggressively.
Concentrating solar thermal has been trampling from the very beginning of the 21st century and notably after 2008. To illustrate, let us take a look at the following chart which explains what happened to the solar energy market in the USA during 2000-2009.
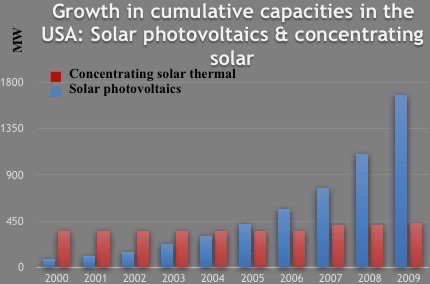
Figure 01: Cumulative solar photovoltaics and concentrating solar thermal capacities in the USA [1]
The chart clearly illustrates that concentrating solar has lost its fame in 2005. Further, it can be noticed that the cumulative solar photovoltaic capacity has been skyrocketing from the beginning of the 21st century though no significant change has been made by concentrating solar power during the same time period.
Firstly, scalability is one of the secrets that photovoltaic technology dominates in the solar energy industry with a cumulative worldwide capacity of 308 GW whereas the cumulative capacity of concentrating solar thermal was merely 6 GW by 2016, as illustrated by the column chart below [2].
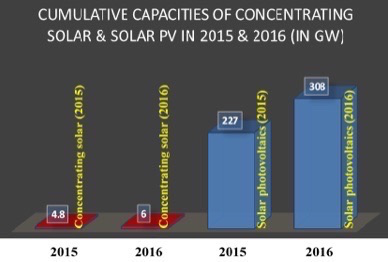
Figure 02: Worldwide cumulative solar photovoltaic and concentrating solar thermal capacities in 2015 & 2016 [2, 3]
As we can see it, the cumulative capacity of solar photovoltaics has grown by 81 GW to reach a capacity of 308 GW by 2016 from 227 GW in 2015. It is, however, interesting to see that the growth of concentrating solar thermal is merely 1.2 GW during the same period of time. The outstanding difference manifests the degree of practical feasibility associated with two technologies.
Above chart implies: Solar photovoltaics is far feasible than concentrating solar thermal. We otherwise would have had a very different column chart with blue colored columns instead of red colored columns and red colored columns instead of blue colored columns!
Enthusiasm is of paramount importance. Nowadays, many countries are keenly encouraging the investors for solar photovoltaics. Especially, China which is always trying to break world records is now breaking even their own records. Previously, they had set a target to reach 105 GW of solar photovoltaic capacity by 2020. However, they could exceed the target readily in 2017 with a capacity of 112.3 GW by July 2017 setting a new target of 213 GW for 2013.
Compare the China’s new target (2013 GW) with the previous target (105 GW). They have doubled their own previous target for 2020. This means the solar photovoltaic capacity has been expanding at an unpredictable rate making the forecasts extremely sterile.
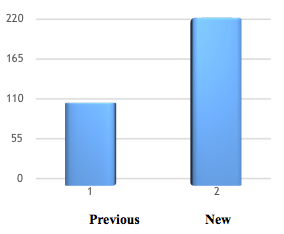
Figure 03: China’s previous and revised targets for solar photovoltaic capacity by 2020
China is now guiding the world towards a Sun-powered society braking their own targets. Estimations are being exceeded making overestimations the most reliable…
Today, China, Germany, Japan, USA, Italy, UK, France, India, Australia and Spain are top ten leaders with large solar photovoltaic capacities. We can see that most of these are outside the Sunbelt which receives a much weak amount of solar irradiance compared to the Sunbelt countries. Therefore, these incredible achievements reflected by countries outside the Sunbelt (Germany, France, etc.) clearly have brought to light an unbelievable potential for solar photovoltaics in Sunbelt countries such as India, Pakistan, Bangladesh, China, Myanmar, Sri Lanka, USA (South), etc. as Sunbelt countries receive a great deal of solar radiation throughout the year. Anyhow, most of Sunbelt countries have not yet understood the value of solar energy which can be made a God’s gift if exploited properly.
Through hard work and perseverance, Germany could work its way up to the country with the second largest photovoltaic capacity. Being a country outside the Sunbelt, Germany is an obvious showcase to both Sunbelt and snowy countries like France and the UK for successful adaption of photovoltaic technology. Developing countries are, however, far lagging behind the European countries even though most of the developing countries are located within the Sunbelt. Anyway, a large majority of developing countries located in the Sunbelt like China, India, and Morocco are now increasingly turning towards solar photovoltaic technology.
No one can predict to what extent solar photovoltaics are going to serve the world.
But one evident fact from the recent past…
Solar photovoltaics would keep breaking the pre-set estimations…
Discouraging to predict the cumulative capacity but heavily encouraging to invest in photovoltaics….
References
[1] Devabhaktuni, V., Alam, M., Depuru, S. S. S. R., Green II, R. C., Nims, D., & Near, C. (2013). Solar energy: Trends and enabling technologies. Renewable and Sustainable Energy Reviews, 19, 555-564.
[2] Kumar, V., & Goyal, N. (2018). Comprehensive Study of Different Renewable Energy Resources such as Hydro Energy, Solar Energy and Wind Energy.
[3] Kabir, E., Kumar, P., Kumar, S., Adelodun, A. A., and Kim, K. H. (2018). Solar energy: Potential and future prospects. Renewable and Sustainable Energy Reviews, 82, 894-900.
[4] Mathews, J. A. (2017). China’s Electric Power: Results for first half 2017 demonstrate continuing green shift. Asia-Pacific Journal: Japan Focus, 15 (17).
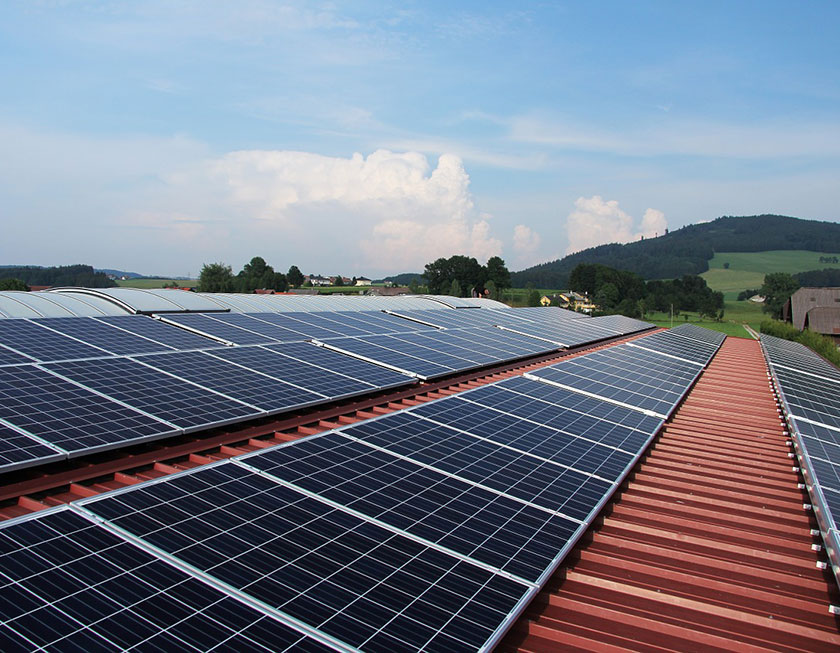
Scalability is a hallmark of solar photovoltaic technology. It is not just a single advantage. It paves the way for a bunch of benefits. A benefit-generator!
In this article, we are going to discuss some key benefits of scalability embedded in the solar photovoltaic technology.
As we already know it, concentrating solar is still not a scalable technology. It is feasible at the utility-scale only. Simply, concentrating solar attracts utility-scale investments but is born with a stumbling block to retail and medium-sized investors. That’s why nobody is going to have a concentrating solar thermal system on his/ her rooftop. Anyway, tens of thousands of householders have already get installed solar panels on their rooftops!
Why?
Unlike concentrating solar power, solar photovoltaic is a fully scalable technology, as we discussed earlier. One can get installed a 1 kW, 3 kW or 5 kW system on his rooftop depending on his requirement. An investor having a sufficient amount of funding can even think of a utility-scale system having a capacity of 1 MW, 5 MW, 10 MW…
Simply, solar photovoltaics technology fits almost all residential, commercial, and utility-scale electricity generation projects whereas concentrating solar thermal is ill-suited to small, mini and micro-scale electricity generation.
Solar photovoltaic technology: How much scalable it is…
Let us study the following tables which compile randomly selected solar photovoltaic farms in different capacity ranges.
Table 01: Solar photovoltaic farms with capacities of 1 GW or higher
| Capacity | Name of the project | Country | Reference |
| 1.5 GW | Tengger Desert Solar Park | China | [1] |
| 1 GW | Datong Solar Power Top Runner Base | China |
Table 02: Solar photovoltaic farms with capacities in the range of 500 MW < 1 GW
| Capacity | Name of the project | Country | Reference |
| 900 MW | Kurnool Ultra Mega Solar Park | India | [1] |
| 850 MW | Longyangxia Dam Solar Park | China | |
| 648 MW | Kamuthi Solar Power Project | India |
Table 03: Solar photovoltaic farms with capacities in the range of 100 MW 500 MW
| Capacity | Name of the project | Country | Reference |
| 500 MW | Amargosa Farm Road Solar Power Project | USA | [2] |
| 400 MW | Gadsden Solar Farm | USA | |
| 250 MW | California Valley Solar Ranch | USA | |
| 130 MW | Centinela Solar Project | USA | |
| 110 MW | Catalina Solar Project | USA |
Table 04: Solar photovoltaic farms with capacities in the range of 50 MW < 100 MW
| Capacity | Name of the project | Country | Reference |
| 97 MW | “Sarnia Photovoltaic Power Plant | Canada | [3] |
| 84.2 MW | “Montalto di Castro Photovoltaic Power Station | Italy | |
| 78 MW | Solarpark Senftenberg | Germany | |
| 60 MW | “Olmedilla Photovoltaic Park | Spain |
Table 05: Solar photovoltaic farms with capacities in the range of 10 MW< 50 MW
| Capacity | Name of the project | Country | Reference |
| 49.9 MW | Turning Point Solar | USA | [2] |
| 45 MW | Avenal Solar Generating Facility | USA | |
| 25 MW | Desoto Solar Energy | USA | |
| 20 MW | Stroud Solar Station | USA |
Table 06: Solar photovoltaic farms with capacities in the range of 1 MW≤ 10 MW
| Capacity | Name of the project | Country | Reference |
| 10 MW | Green Infra Solar Energy Limited | India | [4] |
| 10 MW | Bavarian Solarpark | Germany | [5] |
| 5 MW | Aerojet | USA | [2] |
| 5 MW | Sivaganga Photovoltaic Plant | India | [4] |
| 2.144 MW | Petchaburi | Thailand | [6] |
| 1 MW | Santa Rosalia | Mexico | [7] |
All these facts say a lot about the astonishing degree of scalability accompanied by solar photovoltaics!
Especially, millions of people have already invested in rooftop solar even though an average citizen cannot invest in a concentrating solar thermal project. This supports the simple rule: One may have enough money to have a boat but not a ship!
Traditionally, electricity is generated by centralized, large-scale power plants. Most of such plants are located far away from the areas where electricity is needed and therefore, they require expensive/ massive transmission infrastructure. In addition, there is a huge energy lost in the electricity transmission in such centralized electricity generation. A distributed generation network, on the other hand, creates a golden opportunity to generate electricity where it is needed and thereby helps minimize the energy lost. Further, such network helps reduce the stress or load on the transmission lines and needs for expensive upgrades in the electricity transmission network. Norms have been changing so fast. Nowadays, instead of centralized large power plants, governments and policymakers are now enthusiastically encouraging the investors for distributed electricity generation systems. Scalability of solar photovoltaics makes it an ideal for distributed electricity generation (rooftop solar for residential and commercial buildings). So, solar photovoltaics has been in the spotlight. Various incentive mechanisms have been introduced by many countries inspiring their people to invest in distributed generation systems (especially, rooftop solar). This has been a win-win for both the country’s economy and individual electricity producers.
Power of incentives
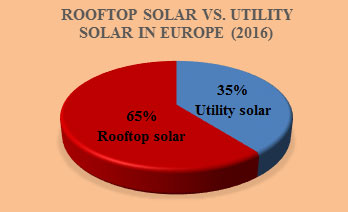
Figure 01: Rooftop Solar Vs. utility solar in Europe (2016) [8]
Most of the European countries have introduced some overwhelmingly impressive incentives for distributed solar photovoltaic systems. The result is quite astonishing that cumulative solar photovoltaic capacity in Europe was 105 GW by 2016. Surprisingly, as much as 65% of it (68 GW) was rooftop-based solar [8]. This is an ideal example to demonstrate the role of incentives and their power in attracting public attention towards rooftop solar. And it has been an aggressive attraction, as shown in the pie chart above!
In the next article, we will see how photovoltaic technology has been competing against concentrating solar thermal technology.
References
[1] Šantić, A., & Aksamovic, A. (2018, May). Photovoltaic plants in Bosnia and Herzegovina—State and perspectives. In 2018 41st International Convention on Information and Communication Technology, Electronics and Microelectronics (MIPRO) (pp. 1501-1506). IEEE.
[2] Mendelsohn, M., Lowder, T., & Canavan, B. (2012). Utility-scale concentrating solar power and photovoltaics projects: A technology and market overview. Contract, 303, 275-3000.
[3] Najafi, G., Ghobadian, B., Mamat, R., Yusaf, T., & Azmi, W. H. (2015). Solar energy in Iran: Current state and outlook. Renewable and Sustainable Energy Reviews, 49, 931-942.
[4] Khare, V., Nema, S., & Baredar, P. (2013). Status of solar wind renewable energy in India. Renewable and Sustainable Energy Reviews, 27, 1-10.
[5]Trevisani, L., Fabbri, M., & Negrini, F. (2006). Long-term scenarios for energy and environment: Energy from the desert with very large solar plants using liquid hydrogen and superconducting technologies. Fuel processing technology, 87 (2), 157-161.
[6] Chimres, N., & Wongwises, S. (2016). Critical review of the current status of solar energy in Thailand. Renewable and Sustainable Energy Reviews, 58, 198-207.
[7] Alemán-Nava, G. S., Casiano-Flores, V. H., Cárdenas-Chávez, D. L., Díaz-Chavez, R., Scarlat, N., Mahlknecht, J., & Parra, R. (2014). Renewable energy research progress in Mexico: A review. Renewable and Sustainable Energy Reviews, 32, 140-153.
[8] Park, W. M. W. (2017). THE 44th IEEE PHOTOVOLTAIC SPECIALISTS CONFERENCE.
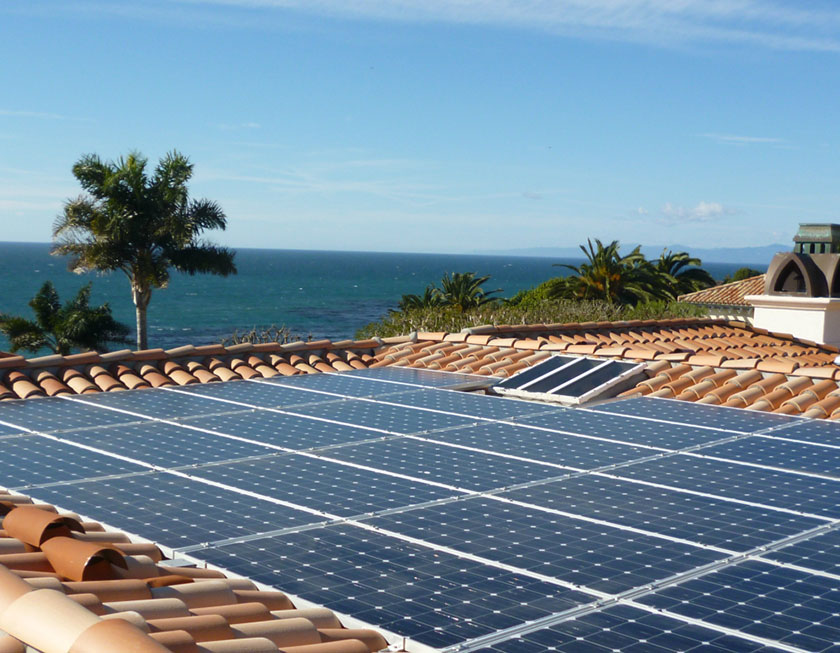
We need an extension to our previous discussion simply because a few pages is not enough to encapsulate the benefits of solar photovoltaics.
So…
Let’s expand our discussion to find out some other unparalleled benefits of solar photovoltaics.
Suits better for the dwindling land area availability: As we understood it in the previous discussion, solar photovoltaics are more space-efficient than concentrated solar power. That means solar photovoltaics generates a greater amount of electricity per unit area than concentrating solar systems. In this case, it is important to realize that the world’s available land area for solar energy harvesting is continuously shrinking due to the increasing demand for land that accelerated by global population growth. One day, space-efficiency would become one of the most critical factors in determining the most suitable solar energy technology pointing more and more attention to solar photovoltaics.
Multi-junction solar photovoltaics technology is the most space-efficient solar energy technology which would probably wipe out the concentrating solar systems in the future. Although this technology is still too expensive for commercial electricity generation, their cost has been falling while their efficiency is gradually being improved. Some believe that multi-junction solar cells with Fresnel lenses would become an economically viable technology in near future. This technology has already archived an incredible efficiency of 46% [1].
Flexibility: Solar photovoltaics can be installed on the ground with or without solar tracking systems. They can also be mounted on a rooftop of a house, factory, or public building where concentrating solar systems cannot be employed at all. Solar photovoltaics are also used as a power source for street lighting.
Building integrated photovoltaics (BIPV) is another new aspect in the renewable energy industry where photovoltaic modules are incorporated into building structures such as windows, facades, roofing tiles, etc. Solar car parking canopy is an ideal example for a successful BIPV application. The goal of BIPV is that they serve as a part of a building structure while generating electricity with no emission. Not only that, BIPV concept allows to access unconventional areas of a building for electricity generation. Some countries have been extensively encouraging their citizen to make use of the BIPV technology by offering additional incentives. For instance, France has introduced a feed-in tariff scheme where BIPV systems are paid up to €0.55/ kWh. Another example is Italy which pays BIPV systems €0.49/ kWh while ground-mounted systems are paid €0.34/ kWh only [2].
Scalability: Concentrating solar systems are based on thermodynamics and rely on a large amount of concentrated solar energy to archive high temperatures. Therefore, they need a large land area to collect a sufficient amount of solar radiation and concentrate. In other words, they are suitable if their capacity exceeds at least several MWs but are not at all feasible in small or residential-scales (to generate a few Kilowatts of power). Solar photovoltaics, on the other hand, fits anywhere concentrating solar does. But it is not the other way around!
Why?
It is due to the fact that solar photovoltaics technology is all scalable. They can be used to power a small calculator, a house (mW to kW) or even a large city (MW to GW).
Unlike concentrating solar, solar photovoltaic technology is a completely scalable and versatile technology!
Environmental impact: Unlike solar photovoltaics, concentrating solar technology uses hundreds of mirrors or reflectors to focus solar energy onto a small region. This creates an extremely hot region in and around the solar receiver making an injurious zone for birds flying across the area.
References
[1] Raza, A., and Ali, J. (2017). A review on carbon nanotubes based organic solar cells. Invertis Journal of Renewable Energy, 7 (4), 187-199.
[2] Celik, A. N., Muneer, T., and Clarke, P. (2009). A review of installed solar photovoltaic and thermal collector capacities in relation to solar potential for the EU-15. Renewable Energy, 34 (3), 849-856.
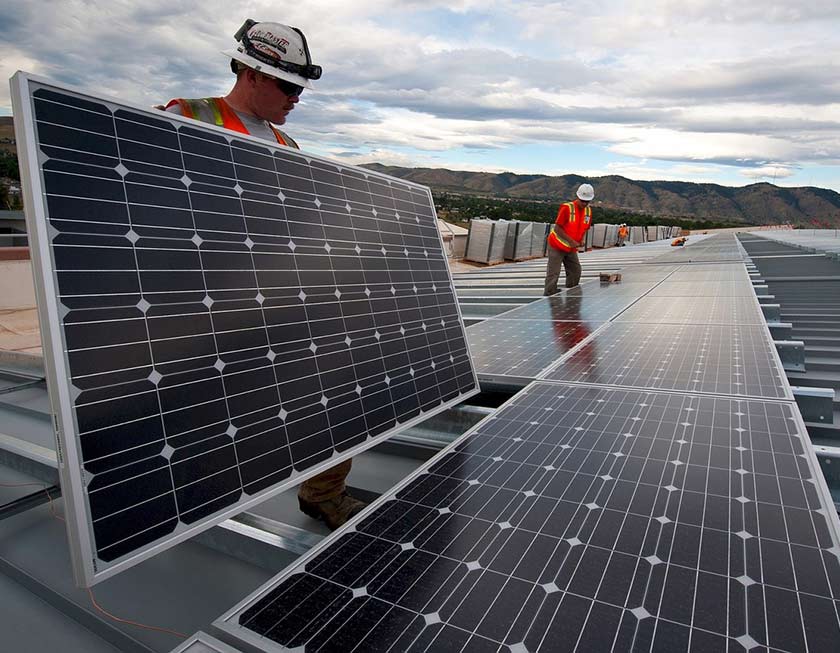
In the previous article, we discussed advantages of concentrating solar power. This article mainly focuses on the advantages of solar photovoltaics.
Energy conversion efficiency: As we discussed in a previous article, the energy conversion efficiency in concentrated solar thermal power depends on the technology. Parabolic trough configuration is currently considered to be the most advantageous concentrating solar technology and thus is the most popular concentrating solar technology which, however, still cannot operate with an efficiency higher than 15%. The typical system efficiency is still in the range of 10-15%. When it comes to conversion efficiency, single crystalline silicon solar cells are now more efficient than ever before offering impressive conversion efficiencies ranging from 18-22%.
In particular, recent years have seen a boom in the crystalline silicon solar cell manufacturing industry which has fueled a huge competition among government and private research institutions to break the existing conversion efficiency. For example, LONGi Solar, a leading manufacturer of high-efficient crystalline solar cells/ modules has broken their own efficiency record to set a new efficiency record of 23.6% for nanocrystalline PERC (Passivated emitter rear cell) solar cells. [1]. Heterojunction back-contact (HBC) solar cells have achieved a striking efficiency of 26.6%.
High efficiency means high energy yield per unit area. So, solar photovoltaics are more space efficient than the parabolic trough systems which are the most realistic concentrating solar technology.
Space efficiency: Space efficiency is primarily determined by the energy conversion efficiency. The higher the energy conversion efficiency the greater the space efficiency of the system. It has been estimated that the parabolic trough systems require 91000 m2 to generate 3855 MW h of electricity while solar photovoltaics (with single axis solar tracking) generates the same amount of electricity 62, 346 m2 (during the first year) [2].
Initial investment needed per kW / Payback time:
Payback time, one of the most important aspects that attracts investors’ attention is largely determined by the overall system efficiency and the initial investment needed.
Following chart illustrates the capital investment needed per kW by different types of solar energy technologies. It can be seen that solar photovoltaics require less amount of capital investment compared to solar thermal tower technology (Note that the value of energy storage capacity offered by the solar thermal tower systems with energy storage is not taken into consideration in this discussion).
Thin film solar cells require the same amount of capital investment as crystalline solar cells but are less space-efficient than their crystalline counterpart (We will discuss later).
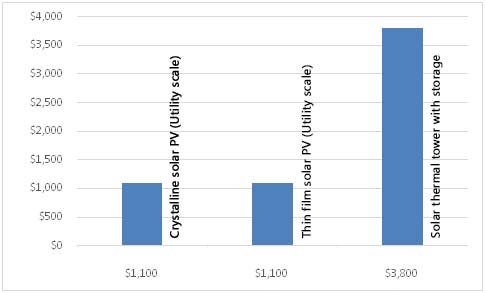
Figure: Capital cost per kW by technology (Lowest scenario) [3]
Unlike concentrating solar technology, cost of solar photovoltaics has been substantially falling in recent years while the efficiency has been steadily increasing. To illustrate, the cost of photovoltaic (per Wattage) decreased from $ 1.3 (2011) to $ 0.5 (2014) [4].
So, it is clear that solar photovoltaics offer the shortest payback time as they are more efficient than the concentrating solar power but require less amount of capital investment.
Solar photovoltaics are born with several other powerful benefits. We will discuss them in the next article.
References
[1] Rodriguez, J., Wang, E. C., Chen, N., Ho, J. W., Li, M., Buatis, J. K., and Wong, J. (2018). Towards 22% efficient screen-printed bifacial n-type silicon solar cells. Solar Energy Materials and Solar Cells, 187, 91-96.
[2] Desideri, U., Zepparelli, F., Morettini, V., and Garroni, E. (2013). Comparative analysis of concentrating solar power and photovoltaic technologies: technical and environmental evaluations. Applied energy, 102, 765-784.
[3] Lazard, N. (2017). Lazard’s Levelized Cost of Energy Analysis–Version 11.0.
[4] Kabir, E., Kumar, P., Kumar, S., Adelodun, A. A., and Kim, K. H. (2018). Solar energy: Potential and future prospects. Renewable and Sustainable Energy Reviews, 82, 894-900.
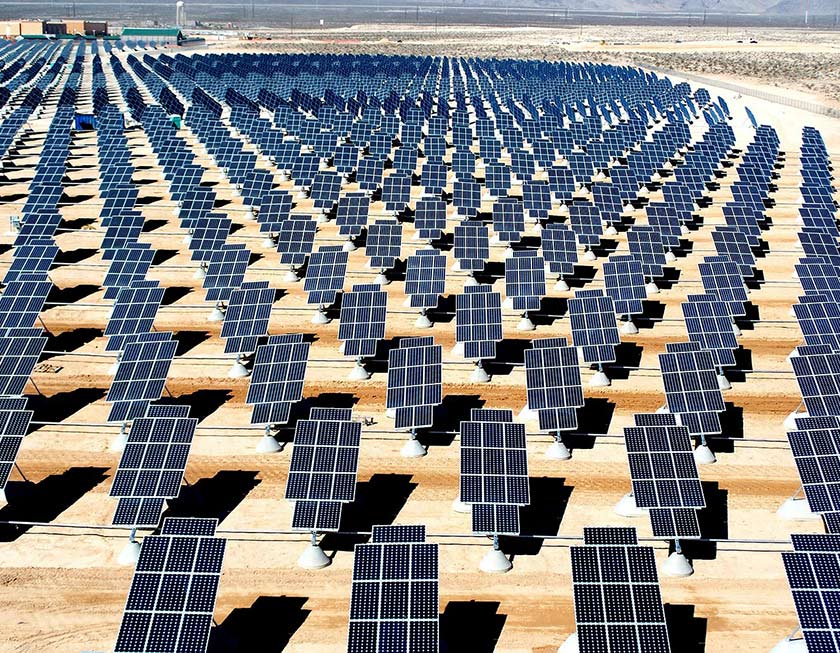
In the previous article, we noticed that the contribution of concentrating solar technology to the world’s energy supply was negligible though the concentrating solar was a well-matured technology.
What about solar photovoltaics technology…
Is it beating the concentrating solar technology or a loser?
First of all, let us take a look at the following table. It tells a lot about two compelling solar energy technologies.
Table 01: Cumulative capacity and growth rate of two solar energy technologies in 2014 and 2015 [1]
| Technology | Year | Change
(%) |
|
| 2014 | 2015 | ||
| Concentrating solar | 4.4 GW | 4.8 GW | +9.091 |
| Solar photovoltaics | 177 GW | 227 GW | +28.25 |
It is true that no commercial-scale concentrating solar power plants would have been constructed if they were not economically viable. So, the above table reveals that both technologies are economically feasible at least in certain regions. There is another important story embedded in the table. It is nothing but the huge gap between the cumulative capacities of two technologies. Further, the growth rate of concentrating solar power lags far behind the solar photovoltaic technology.
This is largely due to the fact that solar photovoltaic technology is often more advantageous over the concentrating solar power technology and is down-to-earth.
But… How can we come to such conclusion?
Well…
There are so many technological, economic, climate, environmental, and geological factors that must be taken into consideration when we evaluate the advantages and disadvantages of concentrating solar and solar photovoltaic technologies.
Let us start our evaluation from the advantages offered by concentrating solar power.
Cheap energy storage: Solar photovoltaics are devices that directly convert solar energy into electricity with the help of photovoltaic effect without an intermediate state and thus essentially require an energy storage in order to supply electricity when they do not receive enough sunlight or during night time. Typically, lithium-ion or lead acid-battery systems have to be deployed as energy storage which considerably increases the investment required. Concentrating solar, on the other hand, convert solar energy into electricity with an intermediate state which is typically heat of a fluid. Heat is one of the best forms of energy to store energy in large-scale for later use. Since concentrating solar technologies always work with an intermediate state of the heat of a liquid, it is much easier to integrate them with a thermal storage system at a reasonable additional cost. Thermal storage is usually molten salt stored in tanks which retain heat efficiently to use when needed. This ability is an added advantage often accompanied by the concentrating solar technology.
Flexibility to work with an auxiliary fossil fuel-fired heaters/ being dispatchable: A concentrating solar power plant equipped with a thermal storage can be easily connected to an auxiliary fossil fuel-powered heater. This enables the system to generate dispatchable electricity at utility-scale and guarantees its full electricity generation capacity even when the Sun is not in the sky or during the night. In particular, this type of power plants can be used either as a gas-powered peaking power plant or as a base-load power plant (just like a coal-powered or nuclear power plant).
Beneficial byproducts: Heat is an essential product created by any type of concentrating solar power plant. Therefore, thermodynamics of concentrating solar power technology relies on both heating from the Sun and a continuous cooling route. The residual heat produced in the process can be used for district heating, industrial processes (soldering, melting, etc.), even for ventilation and air conditioning.
Low CO2 emission: It has been estimated that the amount of carbon dioxide released by concentrated solar plants (29.9 g/ kWh) is less than that of solar photovoltaics (47.9 g/ kWh). This estimation is based on the emission occurs during the entire life cycle and the complete disposal of the power plants [2].
Concentrating solar technology offers all the above-mentioned benefits. However, solar photovoltaics currently generates nearly 50 times the power produced by concentrating solar technology.
Why this?
Let us discuss in the next article.
References
[1] Kabir, E., Kumar, P., Kumar, S., Adelodun, A. A., and Kim, K. H. (2018). Solar energy: Potential and future prospects. Renewable and Sustainable Energy Reviews, 82, 894-900.
[2] Desideri, U., Zepparelli, F., Morettini, V., and Garroni, E. (2013). Comparative analysis of concentrating solar power and photovoltaic technologies: technical and environmental evaluations. Applied energy, 102, 765-784.

Today, concentrating solar and solar Photovoltaics are two proven solar energy technologies which have been successfully implemented in commercial scale to generate electricity.Both technologies are now economically and technically viable in certain regions but each technology has specific and intrinsic constraints. In this article, we are going to determine the technology which will most likely to help conquer the energy crisis in the near future. Then, we will answer the question “Which technology is the best?”
Well.
Concentrating solar or solar Photovoltaics? Which is the best?
Nowadays, this question is creating news bulletins in mainstream news sources. The answer is often controversial, biased and depends on the editor’s point of view. So, prior to drawing our conclusion, let us discuss both the pros and cons of having a concentrating solar thermal power plant and solar photovoltaics. Then we can draw an unbiased conclusion.
Several decades ago, concentrating solar power received much interest and was recognized as a potential renewable energy technology for generating clean electricity. Although it was not cost-competitive compared to conventional fossil fuels, concentrating solar power was a straightforward concept. Many believed that it could be developed to generate grid-scale electricity. And finally, it became a reality.
Several types of concentrating solar power technologies were developed as we discussed in a previous article. Their system efficiency has been continuously improving with the advancement of science and technology. In addition to the continuous improvement in the energy conversion efficiency, this technology has shown outstanding achievements and has now evolved into a commercially viable, technically feasible solar energy technology. Dozens of commercial-scale concentrating solar power plants are currently fully operational and the number of commercial plants keeps increasing with the increasing demand for electricity. The worldwide cumulative energy conversion capacity of concentrating solar thermal power was 3.4 GW, and 4.4 GW in 2013 and 2014, respectively which grew by nearly 9 % to 4.8 GW in 2015.
It is an investors’ rule of thumb that no investment is attracted by a small beer. Simply, the commercial-scale concentrating solar power plants which are currently operational clearly manifest the success of the technology.
If it was not an efficacious technology there would not be operational concentrating solar thermal power plants in the world.
How important they are…
As mentioned earlier, the cumulative capacity of concentrating solar thermal power was 4.8 GW in 2015. This is equivalent to about 10 coal-powered plants each with a capacity of 500 MW. However, this is just a derisory capacity when we compare it with the cumulative hydropower capacity which was 1064 GW in 2015 and current global power demand, 17.5 TW [1, 2].
Why concentrating solar thermal power capacity has not been proliferating fast? It is one of the most matured solar power technology, though.
What is wrong with it?
Let us discuss in the next article.
Reference
[1] Kabir, E., Kumar, P., Kumar, S., Adelodun, A. A., and Kim, K. H. (2018). Solar energy: Potential and future prospects. Renewable and Sustainable Energy Reviews, 82, 894-900.
[2] Hu, A., Levis, S., Meehl, G. A., Han, W., Washington, W. M., Oleson, K. W., and Strand, W. G. (2016). Impact of solar panels on global climate. Nature Climate Change, 6 (3), 290-294.
Image Source
‘Vidulka’ Energy Exhibition conducted by Sustainable Energy authority in collaboration with the Ministry of Power and Renewable Energy will be held for the 6th consecutive year from the 17th- 19th August 2018 at the BMICH. Co-sponsored by JLanka Technologies, in line with their mission of 100% self-sufficient energy in Sri Lanka.
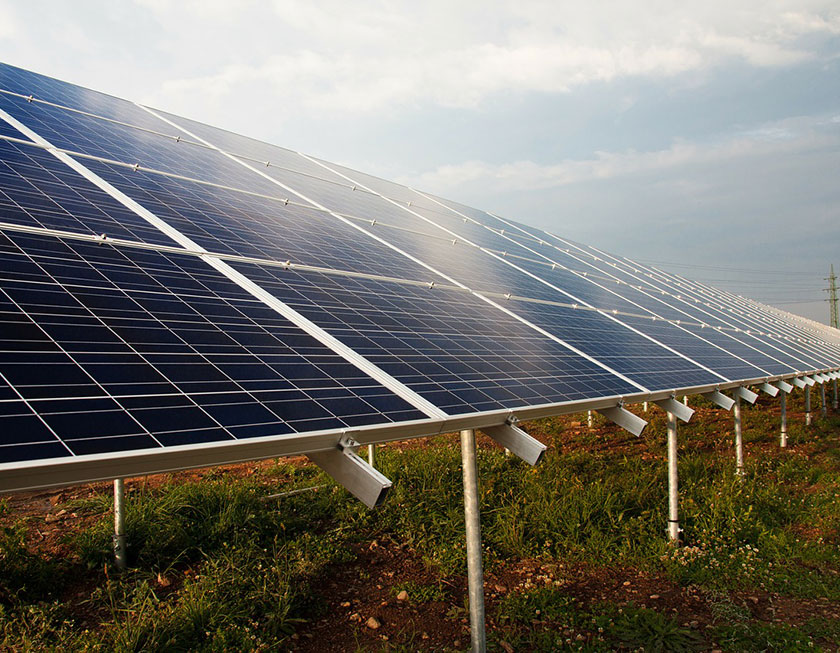
We have already discussed several types of concentrating solar power technologies. In this article, we are going to discuss a crucial technique used to improve the heat-to-electricity conversion efficiency in almost all the concentrating solar power technologies. It is solar tracking technique!
Why solar tracking is indispensable?
We have nothing to worry about the position of the Sun or its relative motion if it rises in a certain direction and stays at rest for several hours until it sets. Simply, if the Sun was a star at rest.
Just assume that our Sun is not in a relative motion with respect to the Earth. Now take a look at the diagram below.
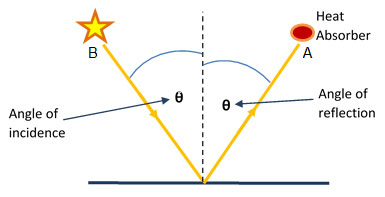
A light ray coming from the Sun hits the surface and get reflected. As we can see it, the angle (θ) at which the light ray hits the surface (a flat reflector) is the same as the angle (θ) at which the light ray is get reflected by the surface (Law of reflection). The point onto which the reflector focus incoming rays depends on both the shape of the reflector and angle of incidence.
In concentrated solar power, the reflectors or mirrors must always be directed towards the Sun in order to harness as much as solar energy possible from solar radiation.
But…
As we know it, our planet is not something at rest. It is rotating about its own axis while revolving around the Sun. As a result, we observe a continuous change in the relative position of the Sun. Of cause, the Sun is not moving around the Earth. But that is how it looks like. A revolving Sun around the Earth!
It is an apparent motion!
So….
It is our Sun’s daily routine that it rises in the East and sets in the West (Due to the relative motion of the Sun)! As a result of the continuous change in the relative position of the Sun, the incident angle of the Sun’s rays is also continuously changing. This continuous change in the angle of incidence of Sun’s rays is what matters to CSP.
Since the relative position of the Sun is continuously changing with time the orientation of the reflectors or mirrors must be changed to follow the Sun’s path.
How solar tracking is achieved?
In order to optimize the energy yield from solar radiation, the orientation of solar concentrating systems is changed with the help of solar tracking devices. Solar tracking devices are devices which always monitor the real-time position of the Sun and keep the solar concentrating systems orientated towards the Sun accordingly.
Solar trackers consume some energy for their operation. However, they can significantly boost the overall system efficiency by about 10%- 100% depending on the geological conditions, and period of time whilst a typical tracking system consumes only about 2-3% of improved energy yield [1]. So, the solar tracking systems play a vital role in CSP systems by improving the energy yield per system and shrinking the payback time of a given CSP system.
How solar tracking systems work
Solar tracking systems are classified into two groups depending on their working principle. They are “active trackers “and “passive trackers”
Usually, active solar trackers employ sensors like LDRs (Light Dependent Resistors) to monitor the Sun’s path and use electric motors to orient the concentrating system accordingly.
Unlike, active tracking systems, passive tracking systems do not employ motors or electronic sensors. Instead, they employ a liquid or compressed gas to track the Sun’s path. These systems do not need electricity as they work with the heat of solar radiation. Upon exposure to sunlight, the gas or liquid expand which rotates the reflector or mirror until it is perpendicular to Sun’s rays.
Currently, two types of tracking systems are available: Dual axis and Single axis systems.
Single axis trackers have only one moving axis. Typically, they are aligned in North-South direction which enables the reflectors or mirrors to follow the Sun’s position as Sun rises in the east and sets in the west. But these systems are unaware of the seasonal variation in the Sun’s path and therefore, they cannot orientate the reflectors or mirrors from the north to the east.
Dual axis systems have two moving axes and thus they can orientate the reflectors or mirrors to follow the Sun very precisely. So, dual axis systems help harness as much as energy as possible.
Single axis vs. dual-axis tracking system
Single axis systems have fewer moving components than dual axis systems. So, single axis systems are less expensive, straightforward, and more reliable compared to their dual-axis counterpart. Further, single axis systems offer a greater life expectancy. However, dual axis systems offer a greater system efficiency than their single axis counterpart.
Which is the best tracking system?
One cannot just determine that the dual axis tracking system is the best. Both systems have specific advantages and disadvantages compared to the other. We should evaluate various factors such as the initial cost of the system, efficiency, location of the site, system efficiency, maintenance required, and system reliability before we decide which tracking system is the best fit for us.
References
[1] Mousazadeh, H., Keyhani, A., Javadi, A., Mobli, H., Abrinia, K., & Sharifi, A. (2009). A review of principle and sun-tracking methods for maximizing solar systems output. Renewable and sustainable energy reviews, 13 (8), 1800-1818.
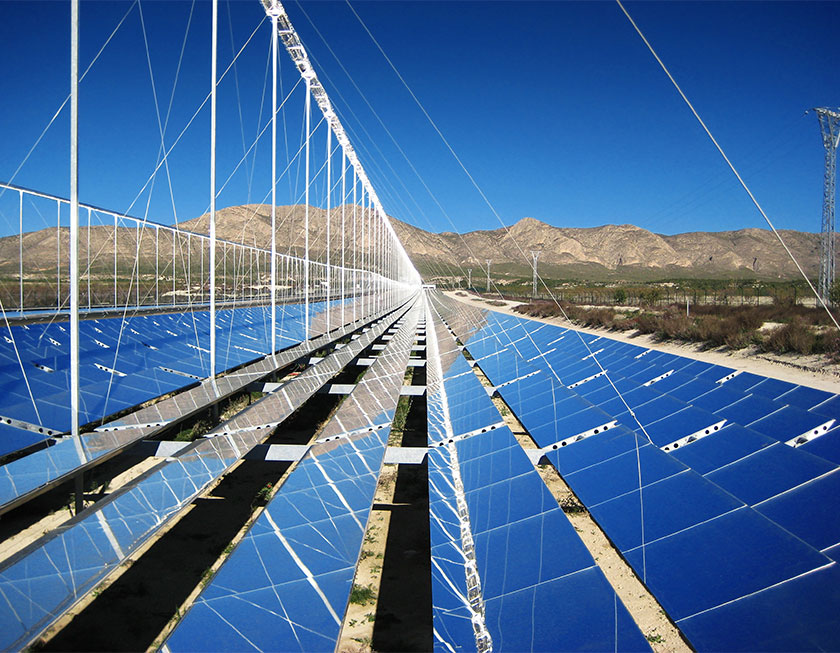
In the previous article, we discussed two concentrating solar power technologies. In this article, we are going to discuss some other concentrating solar power systems, in detail.
Just like parabolic trough systems, linear Fresnel reflectors create a linear focus above them along which is a fixed linear heat absorbing receiver. Fresnel reflectors are flat or marginally curved mirrors equipped with single-axis solar trackers. Just like in other concentrating solar power systems absorbed heat is used to produce steam which turns a turbine and generate electricity.
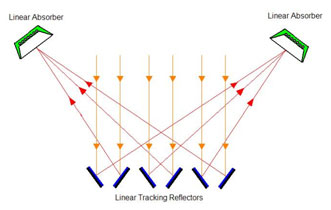
Figure 01: A diagram of a linear Fresnel solar thermal power system with alternatively inclined mirrors
As shown in the above figure, some systems use alternatively inclined mirrors with two linear heat receivers. This configuration helps reduce the space required and also helps avoid any blocking between the mirrors.
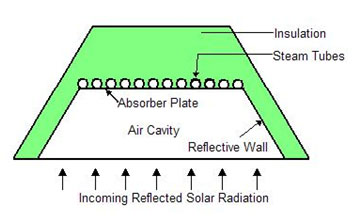
Figure 02: A linear heat receiver of a linear Fresnel solar thermal power system
As shown in above figure 02, these systems have a smart configuration that their heat receiver is always fixed, pointing down, and the exterior of the receiver is well-insulated. This design avoids convective heat loss, minimize radiative loss and improves the system energy conversion efficiency.
The fundamental advantage of linear Fresnel reflectors is their simple geometry. Simply, they are easy and cheap to be fabricated since they are flat or slightly bent mirrors. These systems are more efficient than power tower systems but not competent than dish Stirling systems or parabolic trough systems. The demonstrated annual efficiency is in the range of 9- 11%. Anyway linear Fresnel systems are believed to be a good alternative to parabolic trough systems in terms of the cost, simplicity and land-use efficiency.
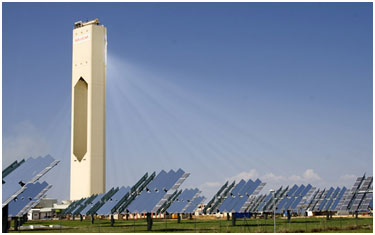
Figure 03: A power tower system
A typical concentrated solar thermal power system employs hundreds of heliostats to concentrate solar radiation onto a receiver installed on a tall tower. Heliostats are large mirrors with two-axis sun-tracking systems which help follow the Sun’s path precisely and thereby significantly improve the overall system efficiency. Inside the receiver is a heat transfer liquid which absorbs focused heat and transfers to a working fluid to produce steam. Just like in coal-powered or diesel-powered plants, the next part of the system is a steam turbine connected to a generator.
These systems usually reach a temperature of 800 ˚C- 1000 ˚C or even higher by concentrating solar radiation 600- 1000 times. The key advantage of these systems is that they archive higher energy concentration ratios and higher temperatures at a single receiving station which allows generating electricity using a single steam turbine, and an electric generator. However, the demonstrated annual efficiency of these systems is in the range of 8- 10%. That means the annual conversion efficiency of power tower systems is almost half that of dish Stirling systems. Furthermore, power tower systems require a large open area to receive and concentrate sunlight. Therefore, this model is more suitable for deserts and barren or infertile locations.
Concentrated photovoltaics where Fresnel lenses are used with solar PVs to concentrate sunlight onto solar PVs is also considered to be a concentrated solar power technology. Unlike other concentrating solar power technologies, this concept is not a solar thermal technology as it does not employ heat receivers, steam generators, turbines and electric generators to generate electricity. Instead, they use solar photovoltaics onto which sunlight is focused using Fresnel lenses.
Let us discuss concentrated photovoltaics technology in a separate article in detail.
References
[1] Müller-Steinhagen, H., & Trieb, F. (2004). Concentrating solar power. A review of the technology. Ingenia Inform QR Acad Eng, 18, 43-50.
Image credits
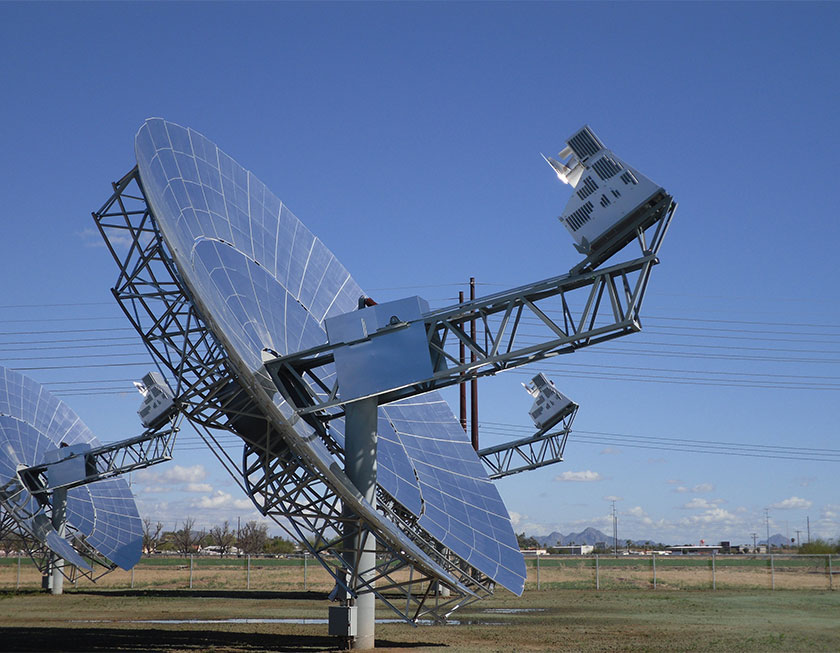
Theoretically, concentrated solar power is one of the simplest renewable energy technologies. The term “concentrated solar power” generally refers to both concentrated solar thermal power (CSTP) and concentrated photovoltaics. To begin with, let us start our discussion from concentrated solar thermal power technology.
Concentrated solar thermal power plants convert solar energy into heat of a working fluid and the heat is then converted into electricity. A typical concentrated solar thermal power plant employs mirrors or reflectors to focus solar radiation onto a small surface area where a working fluid has been enclosed. The fluid absorbs heat from focused solar radiation and channeled into a steam generator which turns a steam turbine and generates electricity.
There are several types of concentrated solar thermal power plants in operation. The key difference among them is that they employ different types of reflectors. But they all (except concentrated photovoltaics) share almost the same concept to convert heat into electricity: It is nothing but a steam-powered electric generator!
As we discussed in the previous article, several configurations of concentrated solar thermal power plants have been developed and some of them have been employed in commercial-scale.
Among them, followings are the most common configurations.
In addition to above, several other configurations are available to concentrate solar radiation. However, most of them are not economically/ technically viable and thus have not yet been used to generate electricity in commercial-scale. So, let us concentrate our discussion on potential concentrated solar thermal power concepts only.
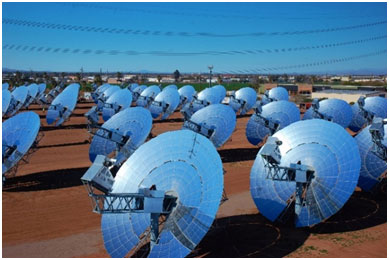
Figure 01: Parabolic dish concentrators with Stirling engines
These systems use parabolic dishes to concentrate solar radiation onto its focal point. The paraboloid is the three-dimensional counterpart of a two-dimensional parabola. A typical parabolic dish system employs a heat receiver (At its focal point) coupled with a Stirling engine to collect heat. Collected heat is then channeled into the Stirling engine which exploits the heat to generate electricity. Their dual-axis solar tracking systems always track the Sun’s path and guide the dish so that the full aperture of the dish is always exposed directly to sunlight. The unique and intrinsic configuration of these systems allows to achieve even over 1000 ˚C and offers the highest conversion efficiency over other concentrating solar power systems. An annual efficiency of 16-18% has been already demonstrated with parabolic dish systems [1]. However, these systems are still too expensive for commercial electricity generation.
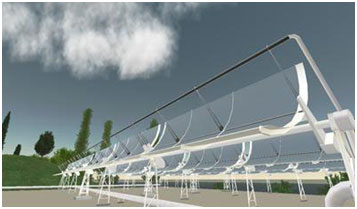
Figure 02: A parabolic trough reflector
The parabolic trough reflectors look like a parabola in the X-Y plane as shown in figure 03. Their three-dimensional design produces a linear focus along the Z-axis along which a heat absorbing tube runs. The absorbed heat is used to produce steam which turns a turbine connected to an electric generator. The demonstrated annual efficiency for this technology is 10- 15% [1].
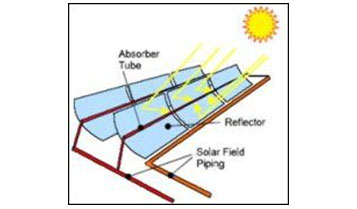
Figure 03: Diagram of a parabolic trough system
This technology is technically feasible and economically cost-effective compared to other concentrating solar power technologies and therefore, parabolic trough technology is today’s most popular concentrating solar thermal technology.
In the next article, let’s discuss some other concentrating solar power technologies.
References
[1] Müller-Steinhagen, H., & Trieb, F. (2004). Concentrating solar power. A review of the technology. Ingenia Inform QR Acad Eng, 18, 43-50.
Image credits
Ctd

As we discussed in a previous article, the intensity of sunlight at the Sun’s surface is about 64100 kW m-2(64.1 MW m-2) which diminish down with the distance and is about 1000 W m-2 at the Earth’s surface when the Sun is at the zenith.

Figure 01: Beam divergence of an EM (sunlight) beam with distance
This reduction in the intensity is due to the divergence of Sun’s rays as they travel a long distance from the Sun (Our Sun would look like a point source if you take a look at the long journey of Sun’s rays travelling from the Sun to Earth).
On average, the amount of energy received by a solar energy harvesting device with an area of 1 m2 at the Earth’s surface is about 1000 J per second (Since the intensity of solar radiation is about 1000 W m-2). But….What if we can increase this figure?
Yes!
It would create a flood of energy and will offer a great opportunity to harness energy from a small area leading to a more space-efficient and more cost-effective energy harvesting technology.
It is obvious that the energy yield (energy harvest) increases when the intensity of solar radiation increases. Further, high energy yield (energy harvest) obviously curtails the payback time.
The higher the intensity of solar radiation the shorter the payback time!

That means, the energy yield by a given solar energy harvesting device would,
So, it is crystal clear that the energy yield per unit area can be improved by increasing the intensity of solar radiation.
But, how can we increase the intensity?
That is the idea of concentrated solar technology.
For ease of understanding, let’s take a look at a simple analogy.
An analogy
It would take minutes to fill your cup with rainwater if you wish to collect rainwater by exposing the cup to rain. It would take, however, much less time to fill the same cup with rainwater if you are collecting rainwater from a gutter outlet.
Why?
The gutter has, of course, a small area but collects rainwater falling onto a large surface area (Roof)! So the gutter outlet would fill your cup in an instant.
Simply, you can collect a large amount of water from a small gutter outlet within a short period of time while a large surface area is needed to collect the same amount of rainwater within the same period of time if you are collecting water from rain.
This is analogous to the concentrated solar energy concept. Incoming sunlight received by reflectors (analogous to a roof) is focused onto a small area (analogous to a gutter) by using mirrors or reflectors and intensified solar radiation is then collected and converted into useful energy. Several configurations have been tested and implemented successfully to concentrate solar radiation. The payback time, initial investment, and system efficiency largely depend on the configuration used to concentrate solar radiation. Each configuration has unique and specific pros and cons. In the next article, let us discuss them one by one.
CTD
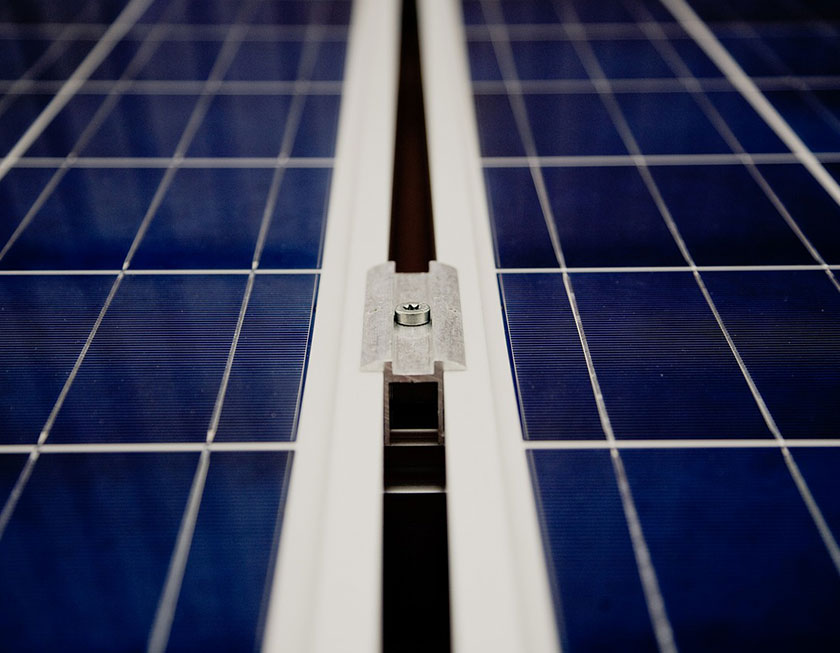
Is your energy bill trying to exhaust your wallet?
If so, your hot water system may probably be the most destructive appliance to your hard-earned money. Switching to a renewable energy source for producing hot water would be a wise decision which would noticeably bring down your spending on energy (Note that electric water heater accounts for the highest electricity consumption of an average house with an electric water heater).
We have several options to produce hot water namely solar, gas instant, electric, and gas storage systems, etc. Among them, use of solar energy is more economical and more environmentally friendly.
It is known to all that both solar hot water systems and solar photovoltaics are sustainable approaches and offer quick financial returns on investment. Although we individuals are always looking for financial benefits, the environmental benefits offered by both technologies are often ignored but cannot be measured in the greenback.
It is quite a controversial question.
One cannot determine the best technology considering only one or two factors. Simply, several factors are to be considered.
Let’s pick them one by one.
This is the most important factor when choosing a technology for water heating. The payback time of both technologies depends on the location, climate, and also energy policies of a given country. Solar hot water systems still offer the quickest payback even with no government subsidies.
Even though payback time of solar photovoltaics is slightly greater than that of solar hot water systems, their manufacturing cost dropped dramatically in the recent past. The cost has been continuously falling with time and thereby reaching the payback time of solar hot water systems.
Today, an apple would be cheaper than a mango.
But tomorrow, mango may be the cheapest!
Time changes everything!
The rule is common for solar energy technologies too!
A decade ago, use of solar hot water systems for heating water was more financially beneficial than electric, gas-powered systems and solar photovoltaics. Solar photovoltaics were easy to be installed but took decades to offset the capital investment making them economically unviable for commercial uses.
Recent change in the price of solar photovoltaics, mimicking the way of meteoroids…
As we can see it in the following chart, the price of solar photovoltaics (price per Watt) has been falling from the sky and reaching the ground. It is a conspicuous drop in the price per watt!
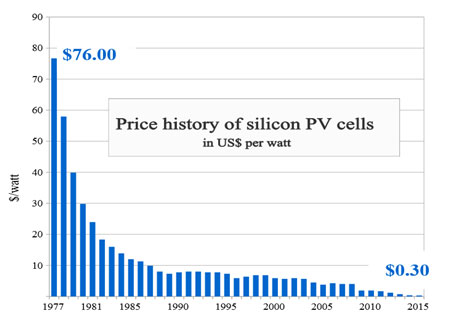
Figure 1: Drop in the price of solar PV from 1977 to 2015 (Source: Bloomberg-New-Energy-Finance [1])
Both technologies were being developed and are still being developed. However, the solar photovoltaic technology could reach several milestones and has made dozens of major breakthroughs during the recent past and it is now wiping out the pride of solar water heating technologies though payback period of solar photovoltaics is still quite greater than that of solar hot water systems. In particular, the price gap between two technologies (per Watt) would be continuously decreasing if the current trend would not change in future.
Although the payback time of solar photovoltaics is slightly higher than that of solar hot water systems, solar photovoltaics have an unbeatable lifespan of 25-30 years whereas solar hot water systems last within 10-15 years.
Another advantage of solar photovoltaics is that the excess electricity generated by the system can be exported to the grid via existing transmission lines. The householder is paid for the amount of electricity he feeds to the grid or as a compensation, he may consume the same amount of electricity from the grid for free, in future. The concept is smart and eliminates the necessity of a backup system to store excess electricity.
Solar hot water systems, on the other hand, need a tank to store hot water.
This would probably be the only concern when choosing a technology for water heating in future as solar photovoltaics technology continues to advance in terms of other mentioned factors. Solar water heating systems are interestingly efficient at collecting solar energy and converting into useful heat. As such, they require a significantly less amount of roof area than a solar photovoltaics do.
Less roof area for water heating means you have more roof area to install solar panels on your rooftop.
Is that all?
Not at all.
Just think
Why do I wear a wristwatch just to have a sense of time?
Why do I carry a calendar just to have a sense of date?
Why do I carry a map just to have a sense of location?
Why do I carry a bulky dictionary just to find a meaning of a word?
Why do I carry a phone just to make a call?
While my smart phone can tell me the time and date, can help find a place or meaning of a word, can help communicate with others… and many more
Solar hot water systems
Solar hot water systems offer you nothing but hot water. In contrast, solar photovoltaics convert solar energy into electricity which can power any electrical appliance.
So, comparing solar hot water systems to solar photovoltaics is like striving to compare apples and oranges!
Solar photovoltaic technology has been able to revolutionize today’s energy industry thanks to the abrupt fall in their prices. Although their payback time is quite high compared to that of solar water heaters, solar photovoltaics are born with a silver spoon in their mouth. They are long-lasting. So, they are more cost-effective than solar water heaters. They provide more energy and cut more greenhouse gasses within their life cycle. Excess electricity can be fed to the grid and the house holder would be paid and thus they do not need a backup to store excess electricity generated.
Especially, if you are out of your home for a longer period, your solar hot water system would be doing nothing but would be heating and be circulating the same water from the tank. In such a case, it is far beneficial to have a solar photovoltaic system than having a solar hot water system.
Taking all these factors into consideration, it can be concluded that the benefits of solar photovoltaics far outweigh their trivial drawbacks.
It would be wise to have a solar hot water system to produce hot water if your rooftop is already covered by solar panels as solar hot water systems are more space efficient than solar photovoltaics. In any other case, solar photovoltaics offer the best package of benefits.
References
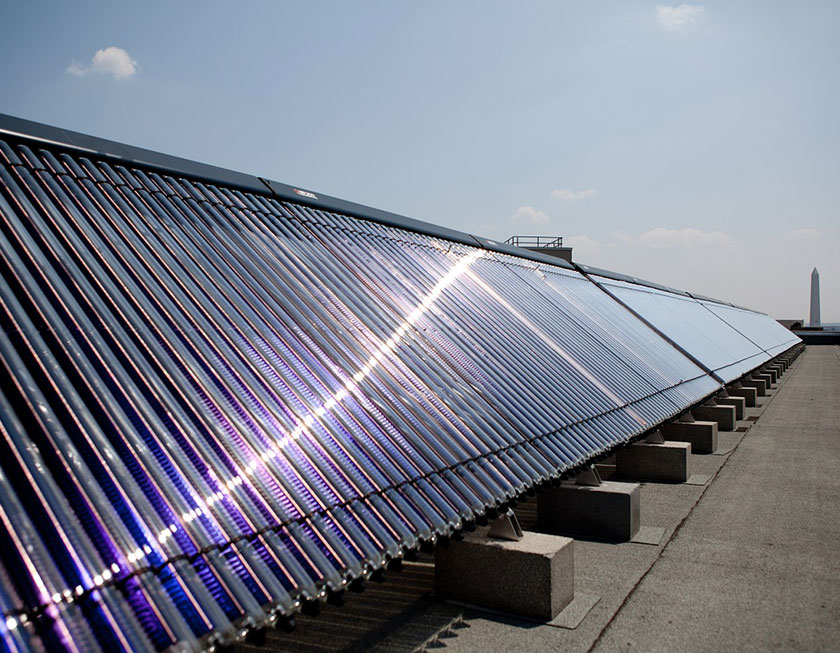
Worldwide Potential of solar water heating
It is often argued that solar energy is not a potential alternative to rapidly depleting fossil fuels.
And it is a commonly accepted misconception about solar energy that…
Solar energy has nothing to do with rapidly increasing energy demand!
However, there are plenty of examples that strongly urge us to through above misconception away.
For instance, the cumulative solar thermal energy conversion capacity reached a milestone of 375 TWh in 2016 [1].
Think!
375 TWh of solar thermal energy means
……One clear example to demonstrate the practical power of sunlight!
That being said, the most popular application of solar thermal energy is solar water heating. Therefore, the credit should largely go to solar water heating.
Solar water heating systems rely on solar energy to produce hot water for industrial and domestic uses. Several technologies have been developed and available on the market with different configurations. We can choose them depending on our requirements, budget, and local weather conditions. A typical solar water heating system is consist of a collector, a heat exchanger, a control system and a heat storage tank.
The collector is the heart of a solar heating system which is excellent at collecting solar energy effectively even on overcast days and converting absorbed energy into useful heat. The heat is then transferred to a heat-transfer liquid or gas. Several types of collectors have been developed namely flat plate collector, evacuated tube collector, evacuated flat plate collector, selective absorber and flat-plate evacuated. While flat plate collectors are the most popular, evacuated tube collectors are also being widely used.
Flat plate collector
A flat plate collector (figure 01) is consist of a front cover (transparent), heat absorber and a housing. The absorber is the key component of a system which converts sunlight into heat and transferred to water inside the absorber tubes. The absorber material should be essentially good at absorbing heat and must be highly heat-resistive. Therefore, heat absorbers are usually made of copper, steel or aluminium.

Figure 01: Flat plate collector
Evacuated tube collector
Flat plate collectors (Figure 02) are more economical than any other type of collectors but heat loss due to convection is overwhelmingly high. Evacuated tube collector concept avoids the convective heat loss by maintaining a high vacuum around the absorber.
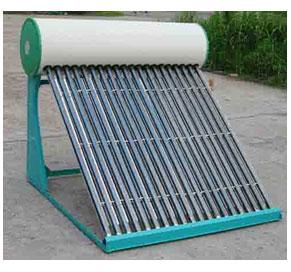
Figure 02: An evacuated tube collector
An evacuated tube consists of a heat piped inside which is a heat transfer liquid or gas (Figure 03). The pipe has been enclosed with a glass tube. The high vacuum between the glass tube and the heat pipe avoids convection heat loss and thus enhances the overall efficiency of the system.
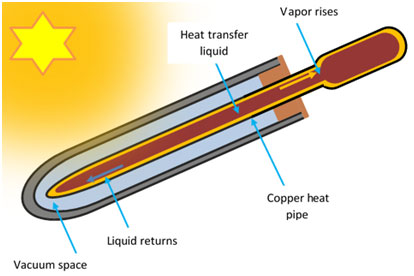
Figure 03: An evacuated tube
The sunlight heats the fluid or gas inside the heats pipe and evaporates. The vapor rises up and enters the heat exchanger at the end of the evacuated tube where heat is delivered to water with an antifreeze agent. The vapor condensed back into its original form (liquid or gas) once its heat is transferred and returns to the heat pipe where it is heated again by sunlight maintaining a continuous heating cycle.
Evacuated tube collectors can achieve very high temperatures but require small collector areas than flat plate collectors. Therefore, evacuated cube collector suit better than flat plate collector concept, especially for cold weather conditions.
Heat exchanger
The role of a heat exchanger is to transfer heat absorbed by the collector to water. Therefore, the material used to design heat exchangers must be good at conducting heat. Copper, aluminium and bronze are some of the good candidates. Anyway, copper has become the most common heat exchanger material owing to its higher heat conductivity and corrosion-resistivity.
Hot water storage tank
These are available in different sizes. They have a well-insulated body to store hot water and retain its heat for days so that hot water is available whenever it is needed.
Pump control system
A solar water heating system maintains a heating cycle in which water in the storage tank is heated systematically. This circulation of the heat transfer fluid is maintained by an electrical pump. Water would be continuously heated whenever fluid in the collector is hotter than the water in the storage tank. However, instead of getting heated water would be cooled in the case where the collector is colder than the water in the tank (early in the morning and evening). The pump should be turned off to stop water getting cooled when the collector is colder than the water in the tank. And it should be turned on when the collector is hotter than the water in the tank.
A pump control system is a smart device which monitors the temperature of both collector and water in the storage tank and turns on or turns off the pump accordingly avoiding water getting cooled and heating water in the tank whenever it is possible. Usually, the pump is turned on when the temperature of collector is at least 5 0C higher than that of water in the tank.
Anyway, there are some configurations (thermosyphon solar water heating systems) that do not need a pump control system in their operation.
Different techniques used to heat water
Currently, solar water heating systems use two main techniques to heat water.
Most of the solar water heating systems need an external power source to keep circulating the heat transfer fluid through the system. Usually, it is satisfied with inbuilt solar panels or power supplied by the grid.
It is a rule of nature that cold water goes down whilst warm water rises due to the fact that density of cold water is lower than that of warm water. Thermosyphon systems are designed to make use of this natural phenomenon to circulate heated water through the system. As such, these systems require neither an electrical pump (to circulate a heat transfer fluid) nor an external energy source (to run a pump).
The tank is fixed above the collector so that cold water sinks down to the collector and absorbs heat at the collector. The density of water drops upon absorption of heat at the collector and thus rises to the storage tank. Meanwhile, cold water from the storage tank sink down to the collector since the density of cold water is lower than the warm water. The rise of hot water to the storage tank and dip of cold water from the tank to the collector keep running the circulation of water through the system and keep heating water continuously as long as the system receives sunlight.
Different configurations of solar hot water systems
Some systems require more collector area but cost you less (flat plate collector concept). Other designs may cost you much but may much efficient at collecting heat. Therefore, such a system suits better if you live in a region where the sky is often cloud covered. The system configuration should fit the local weather conditions, inclination of the rooftop, available rooftop area and your pocket as well.
Advantages of solar water heating systems over conventional electric water heaters
As a sustainable approach, a solar water heating system brings you a range of benefits.
Being an economically successful solar energy technology, solar water heating concept inspired the researchers to develop more successful solar energy technologies. It could discard a variety of misconceptions and overcome a range of economic and technical barriers. Successfully!
It is true that solar water heating technology is still economically and technically viable. However, it seems to be uncompetitive with the falling price of solar photovoltaics.
The falling price of solar photovoltaics forces us to think of solar water heating twice.
Solar water heating or solar photovoltaics?
Let us discuss this issue in a separate article, in details.
Reference
Image credit
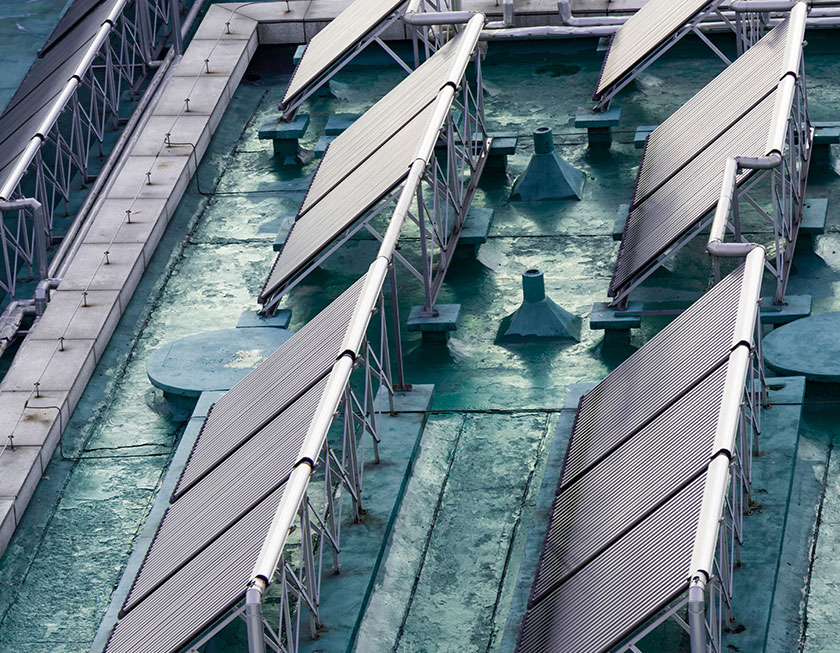
As we know it, water has a specific heat capacity of 4185 J K-1 kg-1. Simply, 1 kg of water requires as much as 4184 Joules of energy to increase its temperature just by 1 0C.
Let us compare the specific heat capacity of water with some other materials below to have a better understanding of water’s specific heat capacity [1].
Table 01: Specific heat capacity of several materials
| Material | Specific heat capacity (J K-1 kg-1) |
| Water | 4185 |
| Copper | 385 |
| Aluminium | 900 |
| Gold | 129 |
| Concrete | 880 |
| Potassium | 750 |
| Sand | 290 |
As we can see it, water is a silent heat store! It absorbs too much energy to show a small change in its temperature.
So…
Producing hot water means energy!
A huge amount of energy!
If we use gas or electricity to produce hot water (for showering, etc.) it would consume a great deal of fuel or electricity. That means a huge amount of money would leave your pocket and would release a huge amount of emissions into the atmosphere!
It depends on the amount of hot water produced and the temperature increment as well.
To illustrate, let us draw attention to a simple calculation related to a small family.
To begin with, it is important to know that the temperature of hot water used for showering is a personal preference. Some people may set the water heating system to deliver hot water at 450 C while some others prefer hot water at 400 C. Anyway, many people prefer hot water at 400 C. The amount of bath or length of time spent in the shower is another personal preference. A typical family of four members each having a daily showering of 10 minutes consumes approximately 400 liters of water a day.
The amount of energy needed to heat 1 L of water depends on the temperature difference between input water and water being delivered. The higher the difference the higher the amount of energy needed.
Now let’s calculate the amount of electricity consumed by a four-member family for hot water showering assuming that the temperature of water at the inlet is 250 C.
Average hot water consumption per family member per day= 100 L
Temperature of water at the inlet= 250 C
Temperature of water at the outlet= 400 C
Density of water= 1 kg/ L
Specific heat capacity of water (C) = 4185 J K-1 kg-1.
Mass of water (m) consumed = 100 L 1 kg L-1= 100 kg
Amount of energy needed to heat 100 L of water = mC∆θ
= 100 kg 4185 J K-1 kg-1 (400 C- 250 C)
= 6 278 000 J
= 6 278 kJ
What does it mean?
One family member consumes 6278 kJ of energy a day to produce hot water for showering.
Note that 1 kWh= 1000 J s-1 3600 s= 3600 kJ
Therefore, amount of electricity needed to produce the same amount of hot water (to heat from 250 C to 400 C)= (6278/3600) kWh= 1.74 kWh
A typical house of four members would consume approximately 7 kWh of electricity per day for showering. This would eventually add about 210 kWh to your monthly electricity bill!
This simple calculation clearly illustrates how electric or gas-powered hot water would cost you an arm and a leg!
So…
Why are you still receiving an unusually high energy bill?
Why are you still burning dead organisms to produce hot water?
Why are you still pumping hazardous emissions into the atmosphere to produce hot water?
Switching to solar hot water would be a wise decision. Instead of dead organisms (fossil fuels) or electricity, solar hot water systems use free energy coming from the Sun to produce hot water. Such a system can satisfy up to 100% of your hot water requirement with minimal amount greenhouse emission and can cut your energy bill by a reasonable amount. Further, they can provide hot water for about two decades for free but do not require frequent maintenance.
How do solar hot water systems work?
Let us discus their potential, technology, different configurations, and advantages, in next article.
Reference
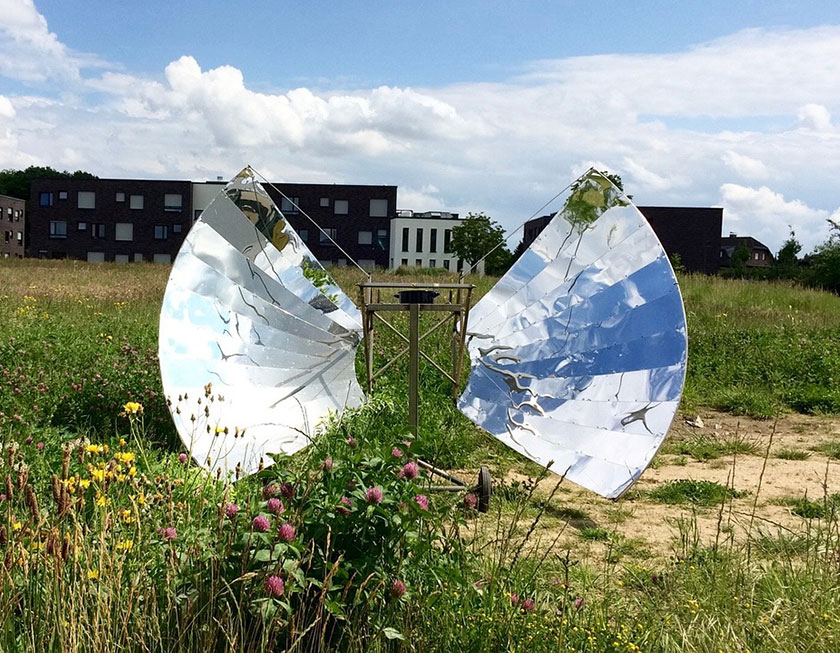
Solar energy was one of the pivotal elements in the formation of organisms on Earth and has been playing a crucial role throughout the evolution from the very beginning to date. Plants absorb solar energy and convert into biomass via a natural process called photosynthesis providing food, medicines, wood for furniture, and many more. Evaporation of water is predominantly governed by solar power hitting the Earth and is the driving force of hydrological cycle which is a decisive factor in determining the fate of living beings.
Nowadays, solar energy technologies have been generating braking technological and economic news bulletin. Anyway, use of solar energy is not a new concept. Even ancient civilizations had recognized the significance of solar energy and duty of the Sun. As such, many ancient civilizations had developed their own traditions to admire and praise the Sun for its precious contribution to their lives. Egyptians, Mayans, Greeks, Romans and many other ancient societies revered the Sun even as a god and worshipped. Mega structures or great temples devoted to the Sun clearly manifest how ancient people think of the Sun and its power!
Human beings have been utilizing energy from sunlight for thousands of years. Ancient Egyptians constructed their buildings so that their buildings absorb and trap heat coming from the Sun during daytime and release during night keeping the temperature at a moderate level. Ancient Romans also used sunlight to keep their homes warmer during the winter. Not only that some societies like ancient Greeks allegedly used solar energy as a weapon for mass destructions by focusing sunlight to set fire on their enemies’ ships!
Many prominent architects designed buildings so that the residents could enjoy maximum use of day lighting inside the buildings. And it is well-known that the use of sunlight was one of the most popular means used to dehydrate and preserve some foodstuff such as lemon, chilies, in ancient times. Then solar cooker was invented by Swiss physicist, Horace de Saussure in 1767 [1]. It seemed to be the very first vendible solar energy technology designed for cooking.
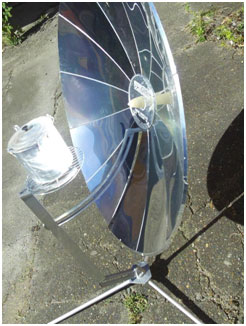
Image: A solar cooker [1]
Everything changed with time.
New solar energy applications and technologies were born with the growing attraction to renewable energy and concerns over climate change and pollution caused by fossil fuel burning. Different solar energy applications and different solar energy technologies are now on the market and ready to be purchased and used.
Solar energy has now become the fastest growing form of energy penetrating into the grids in many countries. Modern-day technology offers a wide range of solar energy applications and technologies which are grouped into three main classes below.
In addition, several other technologies have been developed but they are neither efficient nor economically feasible yet. While solar hot water systems and space heating were the first cost-effective technologies, concentrated solar power technologies and solar photovoltaics have attracted much attention and have been implemented in large-scale to generate electricity.
Each technology offers intrinsic benefits with their own technical and economic constraints. Let us discuss each of them, from next article.
You know how things get heated by sunlight even in temperate climates.
If not, just go outside and search for a boulder or stone and touch. You would feel how hot it is.
You would be thinking… How on the Earth that distant star heats the things on the Earth whilst it is far away from us.
Yes, it is really an amazing topic to think of.
As we know it, water in oceans, rivers, lakes, etc. heats up and injects a vast amount of water vapor into the atmosphere at every point in time.
So… Why do we still use electricity for water heating while the Sun is capable of heating anything exposed to its power?
Well!
Let’s discuss.
We have already discussed the amount of solar power hitting the Earth’s surface. It is nearly 1000 W/m2. Any object absorbs energy from sunlight and gets heated upon exposure to sunlight.
The idea of solar thermal energy technology is neither abstruse nor new. As we discussed in the previous article, even ancient people utilized solar energy to dehydrate some foodstuffs. Anyway, the first successful solar energy device was developed in 1767 by a Swiss inventor Horace de Saussure who is credited with developing the world’s first solar collector to harness energy from sunlight [1]. It could be used for cooking or to heat water. It took more than a century to develop a vendible solar water heating system. Thereby Clarence M. Kemp patented the world’s first commercial water heater in 1891 [2]. Since then solar thermal energy has been used in various applications (water pumping, domestic water heating, swimming pool heating, etc.).
In the beginning, the solar thermal technology could not enter the market as nearby environment provided natural energy sources and sufficient amount of energy for cooking and heating. The rapid increase in global population and urbanization, however, led to shrink the potential and availability of natural energy sources hence limiting access to them. Then people started thinking of the abandoned solar water heating technology. Commercial solar water heaters were then available on the market even in European countries where average solar flux is far lower than Asian and African countries. Its popularity had been gradually growing and the demand then noticeably increased after 1960.
Israel was a trailblazer in manufacturing and installing solar hot water systems and had widely been using solar water heating systems even in the 1960s. Then the global oil crisis occurred in 1973 surprisingly, triggered a sharp increase in the number of solar hot water systems being installed. Currently, rooftop solar hot water systems provide hot water to over 50 million houses in the world [3], saving an overwhelming amount of electricity and fossil fuels thereby cutting tonnes of greenhouse emissions and alleviating the anthropogenic climate change.
Today,
Solar hot water systems are being used in all the continents except Antarctica. China, USA, Spain, Australia, Italy, Greece, and Israel enjoy the highest per capita solar energy utilization for water heating. Several solar hot water technologies have been developed and are being used. Their manufacturing cost, energy harvesting efficiency, and technical features vary with the technology. We can decide which technology fits us depending on our purchasing power, location, climate pattern and average weather conditions
In next article, let us discuss different configurations/ technologies used in solar water heating systems and the advantages of using solar hot water systems as well.
CONTINUED
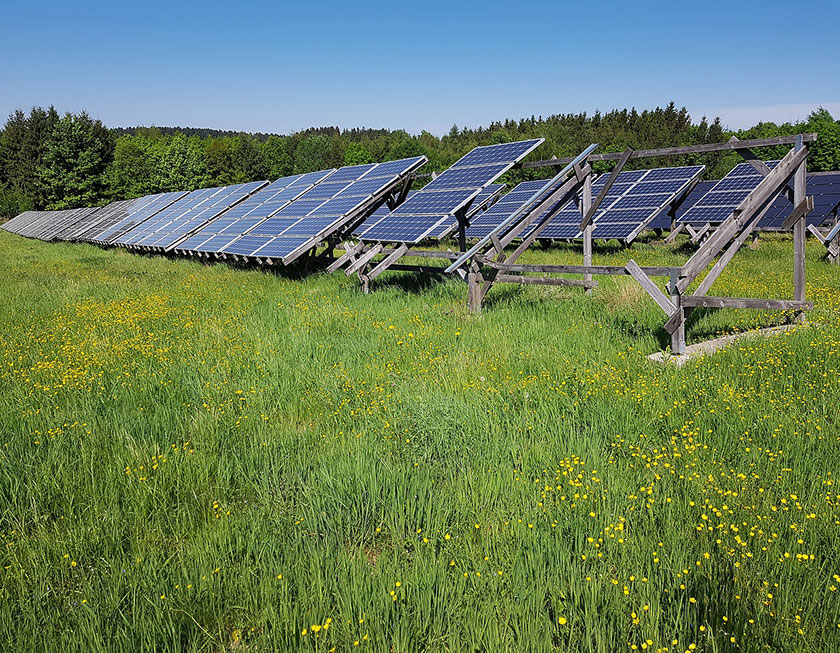
In the previous article, we formulated a simple model to calculate the amount of solar power received by the Earth. Then we realized, our planet receives approximately 127, 000 TW of solar power whilst world power demand was around 17.5 TW. However, as we know it, 71% of the Earth’s surface is covered by oceans and therefore, technically/ economically not suitable for solar energy harvesting [1]. It is clear that forests, reserves, lakes, etc. would not also be available for solar energy harvesting. Further, certain regions in the world (Iceland, Alaska, Greenland, New Zealand, etc.) do not receive an economically viable amount of solar power.
In addition to aforementioned practical constraints, no technology is 100% efficient at harvesting solar energy!
So…
If not, to what extent would it be able to serve?
Well
First, see the gap between the demand and the total amount of solar power hitting the Earth’s surface.
Demand~ 17.5 TW
Amount of solar power hitting the Earth’s surface ~ 127000 TW
Evidently, demand is trivial!
Seizing a small percentage (0.014%) of solar energy reaching the Earth’s surface is sufficient enough. It has also been estimated that we would still have a staggering amount of solar energy being left, approximately 580 TW [2], even if we neglected the low-sunlight and technically/ economically unfeasible areas in the world.
So…
Potential of solar energy is astoundingly unbeatable and no other source of renewable energy offers a greater or at least a comparable amount of energy, to be harnessed.
Note that, 580 TW of power
Just think!
Solar energy is undoubtedly capable of pumping more than enough energy to the human’s energy bucket. The exploitable amount of solar energy would keep increasing as solar energy harvesting technologies are being continually developed leading the way to sustainability. A wide range of solar energy technologies has already been developed. They offer different benefits and have different technical and economic constraints depending on the technology. Essentially, solar energy conversion efficiency also largely depends on the energy conversion technology. Among various solar energy technologies, solar hot water systems, concentrated solar power systems, and crystalline solar cells have widely been employed, all over the world.
From the beginning of this century, the cost of solar energy technologies has been dramatically falling from the sky to ground while conversion efficiency keeps improving- Paving the way for a sustainable energy market.
Today, we all see an unprecedented tendency towards the sustainability.
Never before seen…
Buildings are being roofed by solar panels.
Large brown fields or deserts are being covered by solar collectors and solar panels.
Hotels and houses are getting installed hot water systems.
Energetically…
Dramatically…
Making the 21st century a golden era in the human history…
A carbon-neutral and sustainable era…
Winning the horrendous aftermaths imposed by the climate change!
It is now just a matter of time thanks to the falling price of solar panels and solar collectors.
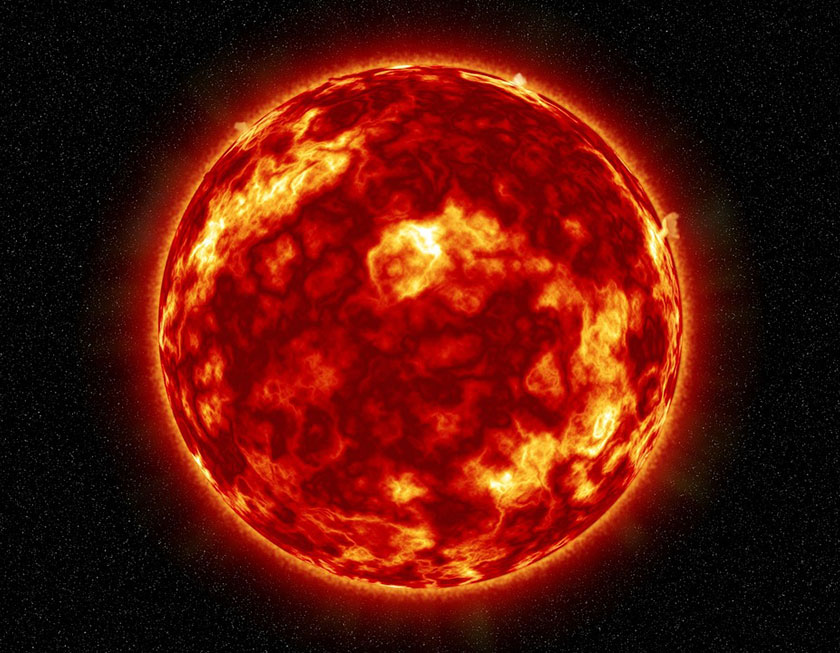
In the previous article, we calculated the luminosity of the Sun and it was found to be about 3.9 1026 W. Later, we realized that our Sun generates energy at a rate equivalent to 2.2×10¹³ times the global power demand (17.5 TW).
So… One can imagine…
How much energy is dissipated by one square meter on the Sun’s surface?
Let’s find out
Total power output from the Sun= 3.9 1026 W
But radius of the Sun is about 695508 km [1].
So, surface area of the Sun= 4πx (695508 km)2
= 6.08x 10¹⁸ m2
Thus, intensity of solar energy at the surface of the Sun=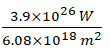
= 6.41x 10⁷ W m-2
= 64.1 MW m-2
In other words, 64, 100 kJ of energy (64, 100 kW of power) is dissipated by each square meter (per second)!
And, annual energy dissipation by one square meter= 64,100 kW x 365 x 24 h
= 5.62 x 10⁸ kWh
Note that the average electricity consumption per capita in the USA is about 7000 kWh. [2]
So, each square meter (1 m2) of the Sun’s surface dissipates a huge amount of energy equivalent to the cumulative electricity consumption of 80286 Americans.
We can see… how powerful our Sun is.
However, physics of a radiating body does not allow EM waves to travel through space without attenuating with the distance. So, Sun’s radiation starts its journey with an intensity of 6.41x 10⁷ W m-2from the Sun’s surface and diminishes with the distance travels.
As we discussed earlier, the intensity of solar radiation weakens down to 1388 W m-2 (intensity of sunlight on a surface perpendicular to the EM waves) when it reaches the Earth’s atmosphere. In addition to the attenuation of solar energy with distance, it further attenuates owing to the influence of Earth’s atmosphere, as we discussed earlier.
The intensity of solar radiation at a given place on our planet Earth is different from place to place and determined by dozens of factors such as latitude, longitude and weather conditions, etc.
Tropical areas receive a notably higher amount of solar energy than other areas. Obviously, the intensity of sunlight on the Earth’s surface declines with increasing latitude towards the North Pole and decreasing latitude towards the South Pole. Anyway, the intensity of sunlight hitting the Earth’s surface is approximately 1000 W m-2 when the Sun is at the zenith.
Now let us calculate… How much solar power is received by the Earth?
First of all, following facts must be taken into consideration.
Radius of the Earth= 6371 km [3]
Therefore, projected area of the earth perpendicular to the Sun’s rays = π (6371×103 m)2
= 1.27×10¹⁴ m2
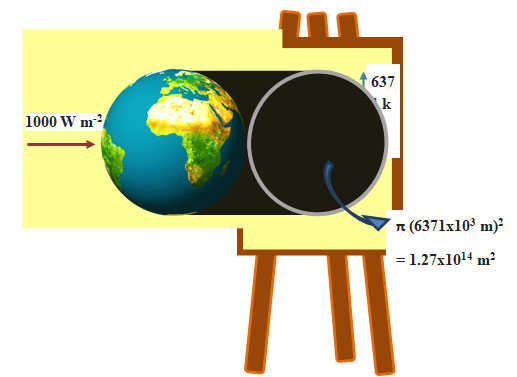
Image: Projected area of the Earth perpendicular to the Sun’s rays
Solar power received by the Earth = 1.27×10¹⁴ m2x1000 W m-2
= 1.27×1012x105 W
= 1.27×10⁵ TW
= 127000 TW
This means our planet receives 127000 TJ of energy, every second.
Note that
The global power demand= 17.5 TW
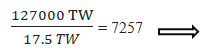 The amount of energy received by the Earth in one day is enough to fulfil the entire global energy demand for almost 7257 days
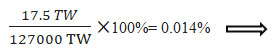 0.014% of the energy received by the Earth is equivalent to the entire global energy demand
100%= 0.014%

මීට වසර 2000 කට කට පමණ පෙර තිරසාර සංවර්ධනය පිලිබඳ සංකල්පය ක්රියාවට නැං වූ ශ්රී ලංකාව එතුලින් කැපී පෙනෙන ප්රතිඵල අත්කර ගෙන ඇත.ශ්රී ලංකාවේ ඉපැරණි රාජධානි විසින් නිර්මාණය කරන ලද කෘෂිකාර්මික ආර්ථිකය පරිසර කළමනාකරණය විනයගරුක සමාජය හා ආර්ථික සංවර්ධනය සමඟින් දැඩි ලෙස බද්ධ වූවකි.
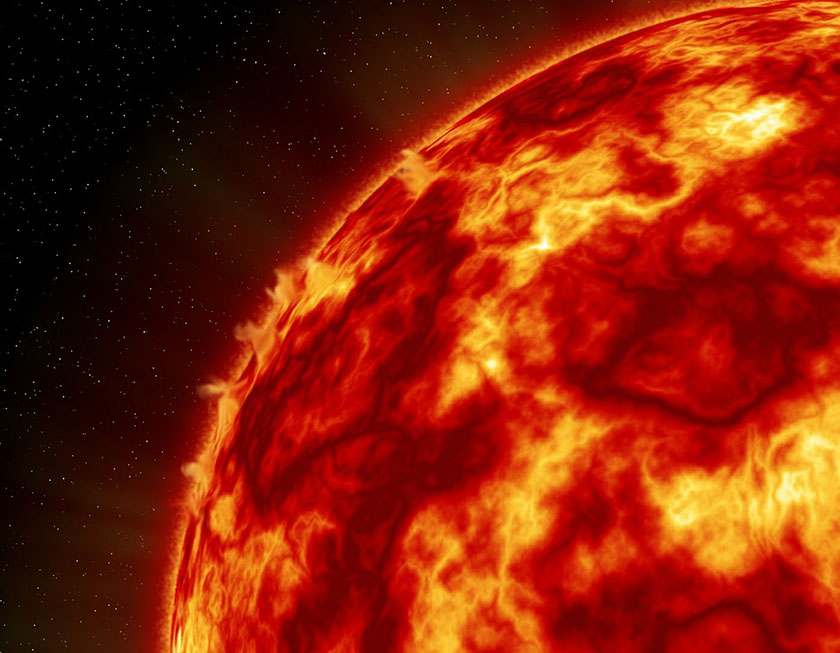
2.3 Potential of solar energy
As we discussed in the previous article, Sun is a huge nuclear fusion reactor. It is a spinning ball of gases around which all the planets revolve. Its energy radiates out to space at a tremendous rate but declines with increasing distance from the Sun.
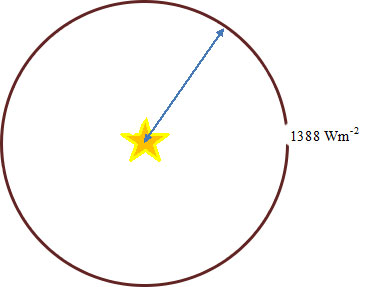 The amount of solar irradiance per unit area per unit time on a surface normal to the Sun’s rays at the Earth’s mean distance from the Sun (one astronomical unit away from the Sun) is about 1388 Wm-2. This value is often known as the solar constant. Solar energy is partially absorbed and reflected back by the atmosphere. Therefore, solar constant is measured using satellites which allow to find out the amount of solar power received by Earth’s atmosphere before entering the atmosphere.
1388 Wm-2 of solar power reaching the atmosphere means one square meter of the Earth’s atmosphere normal to the EM waves receives solar power equivalent to 14 light bulbs each rated at 100 W (28 light bulbs each rated at 50 W)!
Solar irradiance outside the Earth’s atmosphere~ 1388 Wm-2
Distance from the Sun to Earth~ 1.5×10¹¹ m [1]
Surface area of a sphere having a radius of 1.5×10¹¹ m = 4π (1.5×10¹¹ m)2
= 2.8 1023 m2
Luminosity of the (solar power at the Sun) Sun = 2.8 1023 m2 1388 W m-2
= 3.9 1026 W
Current global power demand = 17.5 1012 W [6]
Note that, 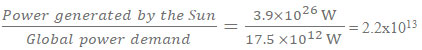
This implies that
Note that, 
So…
The amount of energy generated by the Sun in one second is enough to fulfill the entire global energy demand for almost 697615 years (at current rate of energy consumption)!
The solar irradiance at the Earth’s surface is always less than the solar constant largely due to the absorption and reflection of solar energy by some gases in the atmosphere. In addition, solar irradiance varies from place to place on the Earth’s surface, largely due to the fact that different places on the Earth are irradiated at different angles of incidence (Earth is not a disk but a sphere). However, our planet still receives more than enough energy from the Sun to meet our entire energy demand.
CONTINUED

Energy industry has always been an evolving research field. Researchers have been extensively working to develop new alternative energy technologies and to improve the energy efficiency of electrical appliances. Both attempts are crucial to find a solution capable of solving the energy crisis in future. Among many such research interests in the energy sector, two fascinating concepts have always been mind-bending.
The electrical resistance of a superconducting material is exactly zero at any temperature lower than its critical temperature. As a result, superconducting materials conduct electricity with no energy loss as long as their temperature is maintained below their critical temperature. But no material has still been found to exhibit superconductivity at the room temperature. All known superconducting materials need to be cooled to very low temperatures which is an expensive and complicated mechanism. Any superconducting material with a higher critical temperature would certainly be able to save a substantial amount of energy which would otherwise have dissipated as Joule heating loss in transmission lines and electric circuits.
Fusion is simply the opposite of fission. Just like in a nuclear fission, an enormous amount of energy is released when light nuclei fuse into heavy nuclei. When lighter nuclei fuse into heavier nuclei, the sum of the nuclear mass after the fusion reaction would be less than that of resultant particles. This drop in the mass is converted into energy (kinetic energy of resultant nuclei and particles, radiation) according to the Einstein equation. Nuclear fusion is an unbeatable way of generating energy in terms of the amount of energy that could be gained per 1 kg of fuel. Further, one would be surprised to know that the amount of fusion fuels on the earth is unlimited!
Deuterium and tritium have been found to be the best nuclear fusion fuels. Deuterium can be cropped from sea water without any limit as it is a naturally occurring isotope of hydrogen. Abundance of deuterium is very low compared to that of Protium in naturally occurring water. But oceans are huge reservoirs holding 1.34 billion square kilometers of water [1]. In other words, oceans contain oceans of nuclear fuels which would be enough to provide energy for more than 40 billions of years at present rate of global energy consumption [2]. These facts have brought to light some mind-blowing information about the potential of fusion fuels contained in sea water leading many to anticipate nuclear fusion would be the most promising solution to the energy crisis in future.
Comparing potential of nuclear fusion energy to any other energy source is like trying to compare apples and oranges. But the bad story is that many technical challenges are yet to be overcome to build a commercial-scale fusion power plant. In order to build an economically/ practically feasible fusion reactor, the harvestable amount of energy must be always higher than the amount of energy needed to operate the reactor. But current technology is not capable of harvesting a reasonable amount of energy in nuclear fusion.
The idea of utilizing nuclear fusion energy was first emerged in1950s and was one of the mainstream research field in nuclear physics. Many believed that nuclear fusion was going to replace other forms of energy within next three decades. Researchers have been dreaming of self-sustaining, economically viable nuclear fusion power plants for decades and it still remains a dream, unfortunately.
We may have to wait just one more year, a decade, several decades or perhaps until 2100…
Who knows?
Nobody knows…..
But…
Even though we do not think of it…
We already have a massive fusion power plant in which tons of light nuclei fuse into larger nuclei generating a tremendous amount of energy each second.
Our planet is orbiting around it…
It is at the center of our orbit…
A huge natural fusion reactor…
Sun is the largest power plant in our solar system and is a huge spinning, gaseous ball.
It is a natural fusion reactor which operates 24 hours a day/ 7 days a week/ 52 weeks a year/ 1000 years a millennium, 10 millennia a hectocentennial…
And it does not shut down for maintenance in any circumstances.
Half of the earth is always receiving radiation from the Sun upon exposure to sunlight.
In order to ensure that each region on the earth receives solar energy, our planet is spinning while it is revolving about the Sun offering a golden opportunity to all the countries to harvest energy from a distant fusion reactor!
In next article, let us discuss the potential of solar energy and its capacity to quench our thirst for energy.
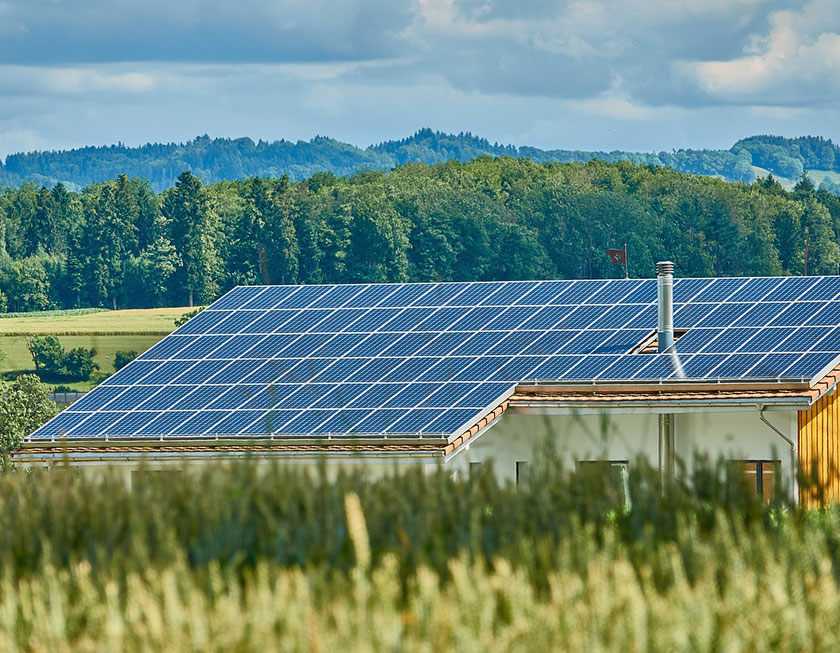
Earth, the one and only habitable planet in the solar system is rich in energy diversity. It is home to a variety of renewable energy sources, fossil fuels and nuclear fuels. Even though plenty of renewable energy is readily available around us we humans have been extensively drilling the earth for fossil fuels to fulfil the energy demand. As we previously discussed, this tendency has led to numerous environmental, ecological, social, and economic problems. Some damages we have done to the earth are extreme threats to the earth’s health and death threats to the living beings.
‘’Sooner or later, we will have to recognize that the Earth has rights, too, to live without pollution. What mankind must know is that human beings cannot live without Mother Earth, but the planet can live without humans’’- Evo Morales [1]
In our very first articles, we discussed manmade environmental damages and their impacts on the climate system. Then we realized that climate change was the most damaging upshot caused by our imprudent, irresponsible activities. We then moved on to discuss the anthropogenic causes of climate change and comprehended that overuse of fossil fuels was the most potent cause. All in all, switching to renewable energy was identified to be the game changer!
Thenceforward we discussed various sources of renewable energy in detail and realized that none of them would be sufficient to satisfy our increasing hungry for energy. Finally, we concluded such renewable energy sources would be insufficient to replace today’s role of oil and thus to quench our thirst for oil.
However, as we learned in the last article, we are still not unlucky!
We are immensely fortunate to have access to a renewable energy source which is certainly capable of providing energy more than enough to fulfill the entire world’s energy demand.
Unlike other renewable energy sources, solar energy is everywhere and abundant!
Especially, it is easy to be harnessed.
And solar energy harvesting does not conduce to noise or air pollution.
Solar energy is heat and sunlight coming from the Sun. Simply, Sun is the place where solar energy emanates. Our Sun generates a tremendous amount of energy to nourish and light up its astronomical members, planets, moons, asteroids and comets. Energy generated by the Sun is irradiated out into the outer space in the form of electromagnetic (EM) waves and meets the Earth’s atmosphere at an average intensity in the range of 1361 W m-2-1362 W m-2 [2]. This amount is, however, reduced due to the absorption of solar radiation by various gases in the atmosphere before reaching the Earth’s surface.
All the indirect solar energy sources that we discussed in previous articles are also naturally derived from solar energy. However, the term ‘solar energy’ mostly refers to the use of solar radiation (sunlight/ heat) for practical applications such as electricity generation, water heating and space heating.

We have previously discussed different forms of ocean energy, hydropower, wind power, biomass and geothermal energy in detail. Finally, we realized that none of them could fulfil the ever-increasing global energy demand.
So… What sort of conclusions can we draw from our previous discussions?
Is it still realistic to expect 100% renewable energy from the aforementioned energy sources?
Before moving onto the talking point, let us go back to some important facts that we discussed in our previous articles.
Now let us take a look at the following table. It encapsulates the maximum amount of power that could be harnessed from various energy sources, according to our previous discussions.
| Energy source | Worldwide power potential (TW) | Nature of the energy source | Derived by |
| 1. Ocean thermal energy | 10 [2] | Marine energy (Indirect solar energy) | Sun |
| 2. Wave power | 2 [2] | Marine energy (Indirect solar energy) | Sun |
| 3. Tidal power | 3 [3] 90 GW | Marine energy | Gravitational pull of Earth-Sun and Earth-moon systems |
| 4. Osmosis power | 2.6 [4] | Marine energy (Indirect solar energy) | Sun |
| 5. Hydropower | 2.36 [5] | Indirect solar energy | Sun |
| 6. Wind power | 71 [6] 4.5 TW | Indirect solar energy | Sun |
| 7. Biomass | 5 by 2050 [7] | Indirect solar energy | Sun |
| 8. Geothermal electricity | 2 [8] | Continuous heat flow from Earth’s interior to surface | Primordial & radiogenic heat |
So,… as we all can realize, none of the above energy sources would be sufficient/ economically viable to fulfil the entire global energy demand which has been estimated to be 63 TW by 2100 [9].
Of cause!
We really do have a potential renewable energy source which can admittedly provide energy more than enough to fulfill the entire world’s energy demand!
It is already around us!
It would be definitely the best of the bunch though we have access to dozens of other renewable energy sources!
What is it?
Let us discuss it in detail from the next article.

We have already discussed almost all the indirect solar energy sources which are unremittingly being replenished by the Sun. In this article, let us discuss another source of renewable energy. Geothermal energy!
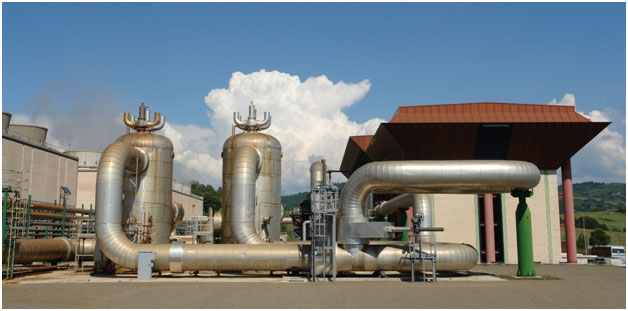
Figure 1: A geothermal plant
Geothermal energy is a renewable source of energy. Just like any other renewable energy source geothermal energy is also naturally being replenished.
However, geothermal energy is not being replenished by the Sun! That means… Geothermal energy represents neither an indirect solar energy source nor direct solar energy source.
So….?
If geothermal energy is not being replenished by the Sun, where does it come from?
Is it really a renewable source of energy?
Well….
It is well known that earth’s interior is a huge heat reservoir with an incredible amount of energy in the form of heat!
This energy predominantly comes from two natural processes.
1. Formation of the earth (Primordial heat)
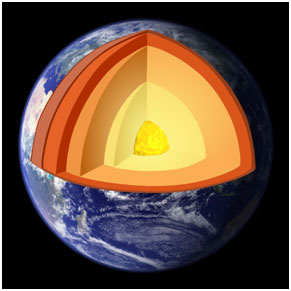
Figure 2: Earth’s layered structure
The entire solar system was formed from a solar nebula made of dust and gasses. After the Sun was formed, the remaining materials collapsed into planets, moons, comets and asteroids due to the gravitation. During the gravitational collapse of the Earth, an enormous amount of gravitational energy/ kinetic energy of collapsing particles/ debris was converted into heat which is now technically referred to as primordial heat of the Earth.
A substantial amount of the primordial heat still persists at the core of the Earth. This heat flows towards the Earth’s surface by conduction and radiates into the outer space thus causing the Earth to cool down with time
2. Decay of radioactive isotopes (Radiogenic heat).
Earth is a warehouse approximately to about three hundred isotopes. Some of them are stable whilst others are unstable (radioactive). As we know, radioactive isotopes decay into lighter nuclei releasing energy according to the Einstein’s equation. Long ago, Earth had had numerous radioactive isotopes which have released a vast amount of energy as they decay. Long-lived radioactive isotopes such as 4019K, 23292Th, 23592U and 23892U [1] still play a crucial role pumping heat continuously to the Earth at a rate of 30 TW [2].
So… The Earth can be treated as a nuclear reactor with a capacity of 30 TW!
A huge natural nuclear power plant! It is fueled by several long-lived isotopes such as , 4019K, 23292Th, 23592U and 23892U .
It is power capacity (30 TW) is equivalent to 30 000 nuclear power plants each with a capacity of 1000 MW!
Long-lived radioactive isotopes would keep pumping enough heat for several billions of years. Therefore, geothermal energy is a renewable source of energy.
Thermal energy comes from the above-mentioned mechanisms can be directly used for space heating or to produce steam which can be then used to generate electricity.
From the Earth → into the space……
The Earth’s temperature should have been rising with time as the radiogenic activity has been generating heat at a tremendous rate of 30 TW!
Earth is, however, a cooling planet!
It has already cooled down to create a habitable home-planet which was an inferno at the beginning. It will be further cooling down with time.
How does it happen?
Well…
As we know, heat is transferred from one place to another via three different mechanisms: Conduction, convection, and radiation.
Any object whose temperature is higher than 0 K radiates its thermal energy in the form of electromagnetic waves into its surrounding. Meanwhile, it would be absorbing radiation from its surround if its surrounding temperature is higher than 0 K. The rate at which an object radiates its thermal energy is proportional to the fourth power of the absolute temperature of the object. Similarly, the rate at which the object absorbs energy from its surrounding is proportional to the fourth power of the surrounding absolute temperature.
An object would be cooling if the object’s temperature is higher than that of its surrounding. The higher the temperature difference the higher the rate at which the object loses its thermal energy.
What about the Earth and its surrounding?

Figure 3: Planet Earth with its atmosphere
Earth’s average surface temperature is 287 K (140 C) [3] while the temperature of the empty space is 2.7 K [4]. The temperature of the space nearby the Earth is, of course, much higher than 2.7 K. But it is still much lower than 287 K. As a result, the Earth has been losing its thermal energy leading to a cooling planet where billions of people and millions of other species live.
The average heat loss from the earth is estimated in the range of 43-45 TW [5]. In other words, our planet Earth is losing its geothermal energy at a rate of 43×1012 J per second (at the lowest scenario).
Yes! It is equivalent to 43 000 000 000 000 J/s.
Moreover, it is nearly 2.5 times the current global energy demand (17.5 TW) and would be higher than the entire energy demand even by 2050 (25-30 TW) [6, 7]. But it is important to realize that none of the technology will be able to harness the entire amount of heat which reaches the Earth’s surface.
The worldwide geothermal electricity capacity in 2015 was estimated at 12.6 GW [8]. As we can see, it is insignificant compared to the rate at which Earth is losing its heat. The lower limit of the geothermal electricity potential is estimated at 50 GW while the upper limit is estimated to be in the range of 1-2 TW [5].
The table below shows the cumulative geothermal electricity generation capacity in several countries.
| Country | Capacity (MW) |
| USA | 3450 |
| Philippines | 1870 |
| Indonesia | 1340 |
| Mexico | 1017 |
| New Zealand | 1005 |
| Italy | 916 |
| Iceland | 665 |
| Kenya | 636 |
| Japan | 520 |
| Turkey | 407 |
| Costa Rica | 207 |
| El Salvador | 204 |
Table 01: Installed geothermal electricity generation capacity as of 2015 [8]
Currently, geothermal energy is being used
Advantages
Disadvantages
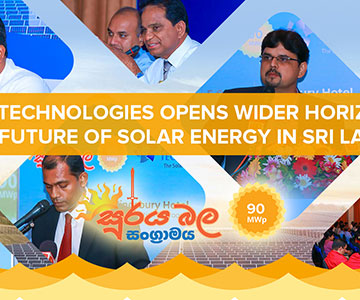
Sri Lanka’s premier Solar Solutions provider JLanka Technologies powered through to the next phase in utility solar by supporting the public power generation programme “‘Surya Bala Sangramaya’ by empowering and educating all stakeholders.
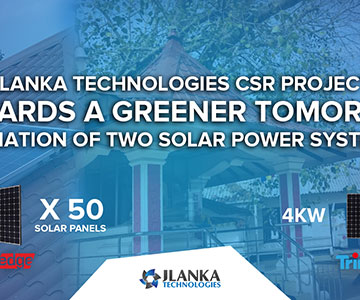
Pioneering in innovative energy saving solutions and novel technologies JLanka Technologies is in a mission to transform Sri Lanka into a sustainable, 100% energy self-sufficient country through innovative renewable energy solutions.
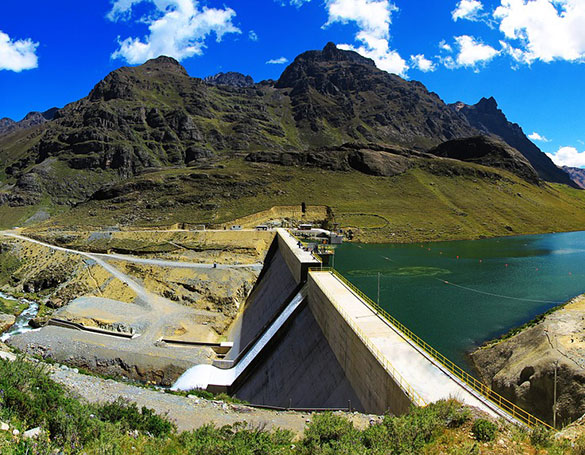
In previous article, we discussed the pros and cons of hydropower. In this article, let us discuss why hydropower is important than other types of renewable energy sources, we discussed in previous articles.
We have already discussed several types of renewable energy sources. Almost all the renewable energy sources except reservoir hydro are intermittent. Also, some of them including hydropower are seasonal dependent.
Intermittent energy sources are energy sources of which power output fluctuates with time. For instance, the velocity and direction of wind vary with time and thus the electric power generated by a wind turbine fluctuates according to the rhythm of the wind speed and direction. This intermittent nature of renewable energy sources negatively affects the grid’s stability and makes it difficult to maintain the load balancing thereby limiting the amount of intermittent energy to be grid-connected. Especially, if the grid largely relies on intermittent sources, the grid should have a mechanism to balance the power demand and power input to the grid. This requires large-scale (pumped hydro, compressed air) and small-scale energy storage (Flywheel, battery, superconducting magnetic energy storage) systems. Such systems are expensive to build and maintain. Therefore, they increase the cost of electricity delivered to the utility customers. However, reservoir hydropower plants can largely replace the role of both large-scale and small-scale energy storage systems thanks to their flexibility and short response time. In a nutshell, hydropower enables the grid to accommodate more and more intermittent energy sources while working as a renewable energy source.
Hydropower plants,
Technically feasible worldwide hydropower capacity and currently available hydropower capacity are 2.36 TW (2360 GW) 970 GW as mentioned earlier [1, 2]. In other words, hydropower can potentially shut down as many as 1390 coal power plants each with a capacity of 1000 MW in future.
Of course, as we discussed in previous articles, worldwide capacity of wave power, ocean thermal energy, osmotic power or tidal power would not be sufficient to satisfy the increasing global energy demand, not to mention hydropower!
However, hydropower can still play a vital role in the battle for climate change since it can help the grid accommodate more and more intermittent and seasonal dependent energy.

Waste is an unnecessary product in our daily life. We do not generate waste purposely. But we cannot stop generating waste though it is unwanted/ unpleasant.
Waste was commonly considered a waste for centuries.
Of course… Waste generation still remains a big challenge.
We should try our best to reduce waste generation as much as possible since waste leads to many negative impacts on our health, economy, environment and society.
The best solution to reduce waste generation is to follow the 5R concept.
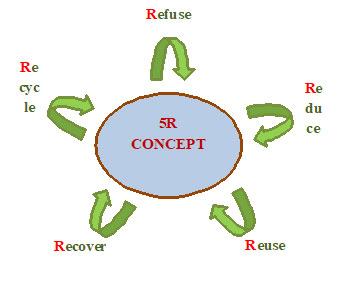
The 5R concept is a proven concept in waste management. However, it is obvious that no single waste management strategy can completely shut off the daily waste generation though some concepts may help reduce the amount of waste to some extent.
So….
What can we do to manage waste?
Waste-to-energy probably would be one of the best solution in waste management.
However, organic waste is one of the different forms of biomass, as we discussed earlier. Solar energy stored in biomass during photosynthesis can be used to generate electricity or heat.
The technology which uses waste to generate electricity in the form of either electricity or heat is commonly known as waste-to-energy. Several waste-to-energy concepts have already been used to generate electricity. Both thermal techniques such as incineration, pyrolysis and gasification and also non-thermal techniques such as anaerobic digestion are currently being used.
Waste is continually generated by us. So, waste-to-energy is a renewable/ sustainable energy technology. And it does not lead to global warming or climate change since waste (biomass) which is the primary fuel in waste-to-energy plants is carbon neutral.
Waste-to-energy plants generate energy from waste which is one of the main challenges in the 21stcentury. In other words, waste to energy technology converts problems into a solution.
Waste-to-energy plants generate electricity or heat from waste. Also, they help alleviate the waste problem. So, waste to energy is a win-win technology.
It has been estimated that an average person in developed countries and developing countries annually generates 521.95–759.2 kg and 109.5–525.6 of waste, respectively [1]. Further, organic waste, paper and plastic accounts for 46%, 16% and 10% of municipal solid waste (Hoornweg & Bhada-Tata 2012). Simply, nearly three quarters of municipal solid waste can be used to generate electricity or heat while greatly reducing the amount of waste.
Anyway, one of the main challenges in waste-to-energy is that they require a continuous supply of combustible waste. Also, most of the waste-to-energy technologies have a lower limit for waste supply. The minimum amount depends on the technology used. This implies not all the regions in the world would be suitable for waste-to-energy plants though waste generation is a common practice in our daily life regardless of the country or region.

Biomass, probably the oldest energy source of humanity, still provides about 10.5% of today’s global energy demand [1].
Traditional biomass (firewood, agricultural residue, cow-dung and charcoal) which makes up 8.48% of the global energy demand is mainly being used for cooking and heating [2]. It is largely harvested in developing countries in Asia and Africa. In traditional practices, people do not ensure another generation of trees. They use biomass as an energy source in traditional biomass stoves which are inefficient and unsafe. Therefore, traditional biomass is neither sustainable nor safe though it is a readily available energy source and as such, extensive use of traditional biomass leads to deforestation and intensifies the climate change.
Biomass is renewable (modern biomass) if and only if it is produced in a sustainable way!
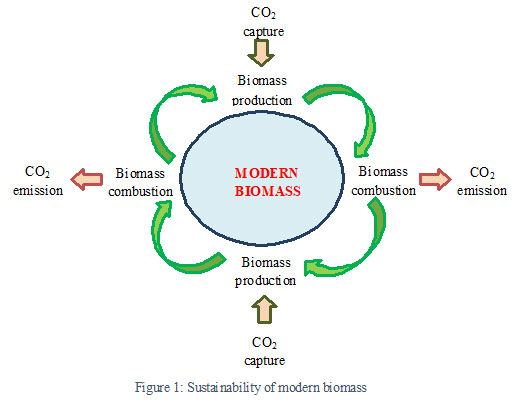
Modern biomass (combustible waste, forest residue, sugarcane, etc.), on the other hand, is predominantly being used in developed countries and also in Brazil to generate electricity/ heat or to produce ethanol, methanol or hydrogen. Unlike traditional biomass, modern biomass is considered a renewable energy source since modern biomass is produced sustainably. Currently, modern biomass provides as little as 1.9% of global energy demand. The interest of the modern biomass as a renewable energy source, however, is growing and of paramount importance as its potential is much higher than its present-day share.
Current worldwide biomass-based electricity generation capacity is estimated at 112 GW. According to recent assessments, the potential of biomass energy by 2050 would be around 5 TW [3]. Thus, modern biomass seems to be a promising source of renewable energy. It helps mitigate the waste problem, lowers the greenhouse gas emission and alleviates the climate change.
However…It is important to realize that 5 TW of power from biomass is equivalent to billions of trees/crops grown in half a billion hectares on our own living planet.
Would this planet earth be able to accommodate such a number while providing space for homes, roads, buildings, cultivation, etc. for 9 billion people [4]?
May be!
But…Just think!
Should we waste already stressed virgin land in the name of biomass?
Should we massacre priceless forests in the name of biomass?
Should we despoil dwelling homes of wildlife in the name of biomass?
Should we consecrate billions of hectares for biomass production in the name of biomass?
Certainly should not…if we have access to other potential renewable energy sources.
Let us see if there such renewable energy sources in next articles.
JLanka Technologies the pioneers in the Solar Power industry together with the Academy of Engineering and Green Technologies, a leading institution that offers courses in the fields of Engineering and Renewable Energy Technologies is in a mission to make a remarkable change of the awareness and capacity building in SGD Goal 7 by train up to 700 youth leaders as “Renewable Energy Youth Messengers”.

Biomass, as the name implies, refers to biological or organic materials. Simply, biomass represents either living or dead, animal and plant materials.
Wood chips, tree branches, biodiesel, landfill gas, ethanol, coconut shells, and sewage sludge represent direct sources of biomass. In addition, various forms of organic waste such as kitchen garbage, cow-dung, straw, poultry litter, yard clipping, sawdust, and rice husk are also excellent sources of biomass fuels. Anyway, plant materials account for nearly the entire amount of worldwide biomass fuel consumption.
Plants are natural food factories and air purifiers!
Raw materials: Water, minerals, and CO2
Energy source: Solar energy
Byproduct: Oxygen
Final product: Food (Energy storage)
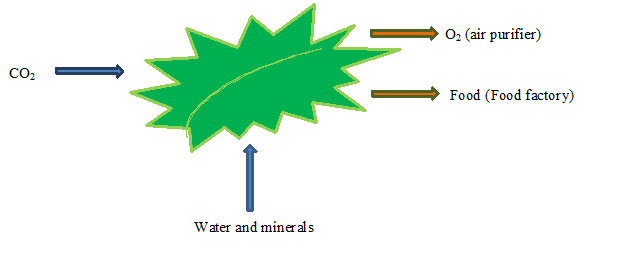
So…. As we can see, trees store solar energy in the form of chemical energy during photosynthesis. During the same process, CO2 is absorbed from the atmosphere thereby lowering the greenhouse effect.
Trees have been assigned to produce food by nature, besides being to be the key player in natural carbon recycling!
All of the aforementioned sources of biomass fuels capture and store solar energy in the process called photosynthesis and it is an unremitting process.
We can grow plants to harvest biomass materials. The harvested organic sources are used to generate electricity or heat. Obviously, carbon dioxide is released when they are burnt. However, we can regrow the plants within a short period of time so that the same or higher the amount of released carbon dioxide is recycled back. Hence, biomass is considered to be a renewable energy source.
People have widely been using biomass, especially for cooking since ancient times. From recent years, however, it is also being used for electricity generation and industrial energy needs in the form of heat.
Developed countries use biomass fuels mainly for electricity generation whereas it is widely being used in developing countries such as India, Pakistan, and Bangladesh for cooking. Especially, Brazil which is a developing country use biomass in large-scale for both electricity generation and ethanol production (to power cars).
So, it is undoubted that Brazil is the best example for a country which has already replaced thousands of gasoline-powered cars by ethanol-powered automobiles.
Fossil fuels or biomass? Both fossil fuels and biomass release greenhouse gases during combustion.
Combustion of biomass fuels, of course, releases greenhouse gasses into the atmosphere. But…Unlike fossil fuels, biomass fuels, however, can be produced within a short period of time as mentioned earlier and therefore, can replace the use of nonrenewable energy sources to some extent. Furthermore, biomass is said to be a carbon-neutral energy source since carbon dioxide emitted during the combustion is neutralized during the next biomass production (photosynthesis). Thereby, biomass as a fuel can lower the emission of greenhouse gasses and alleviate climate change to a certain extent.
A seminar primarily targeting the potential investors of the 1MWp x 90 tender under the theme “Investing in a Clean Future – Understanding the Value Chain of Utility-Scale Solar PV Power Plants” organized by JLanka Technologies will be on held on the 8th of March 2018 from 5pm onwards at The Victorian Ballroom, Kingsbury Hotel along with a networking session and cocktails.

With tremendous success last year, Sri Lanka Institute of Architects is proud to present the 36th Annual edition on the 22nd to 25th of February 2018 at the Bandaranaike Memorial International Conference Hall in a superior manner.

The 23rd Annual General meeting of the National Chamber of Export will be held on the 11th of January 2018 at the Hotel Galadari Colombo from 6.30pm onwards. The NCE meeting is to appoint Office Bearers and Council Members for the year 2018.

As we discussed in a previous article, hydropower is the oldest source of energy that the humans used to generate electricity. The oldest source of energy that they used in day to day life was not hydropower but firewood and other types of biomass. Afterward, they identified wind power as a potential energy source. They used wind power to pump water, to grind grain, to pump salt water from the sea for salt making. In addition, wind power was the sole source of energy for sailors, in navigation.
Wind is simply the flow of air from one region to another. It is often explained in terms of wind speed and direction from which wind blows.
As we know it, the amount of energy absorbed by a given place on the earth is determined by several factors such as the geographical location of the place, and time (Since the earth is revolving about the Sun). The temperature on the earth varies from place to place due to this absorption differential which in turn creates pressure differences in the atmosphere.
Winds are mainly caused by the atmospheric pressure differential. Air flows from the high-pressure areas to low-pressure areas creating winds. The direction of winds is further deflected by the Coriolis force that experienced by the flowing air. (The moving air experiences a force called “Coriolis force” due to the rotation of the earth)
Wind speed and direction depends on several factors such as pressure gradient, local weather conditions, Coriolis force, and friction. However, wind speed is largely determined by the pressure gradient while the direction of the winds is largely influenced by the pressure gradient and Coriolis effect.
Obviously …The root cause of wind is the temperature difference in the atmosphere which caused by the differential solar energy absorption by different locations on the earth.
So, we can conclude that origin of wind power is nothing but solar energy!!!
Wind power is an indirect form of solar energy and a renewable source of energy.
Winds carry a great deal of energy from place to place in the form of kinetic energy of air. This energy can be harnessed in various ways. In this discussion, let us focus only on wind turbines used to generate electricity.
Currently, wind power is largely being used to generate electricity, especially in Europe. China, USA, Germany, India, Canada, France, Spain, and the UK are some of the leading countries which generate electricity from wind power in GW-scale. The cumulative installed wind power capacity has been rapidly growing notably from 2005. This fast growth can be attributed to the increasing demand for energy, increase in oil price, decreasing cost of wind power-based electricity and the global trend towards green concepts.
Wind power is one of the two largest resources of renewable energy (Largest resource is solar energy). However, almost all the energy sources possess some disadvantages, not to mention wind power.
Following chart illustrates the worldwide cumulative installed wind capacity with forecasted data and provides projected information from 2015 to 2050 under three different scenarios namely, new policies, moderate and advanced.
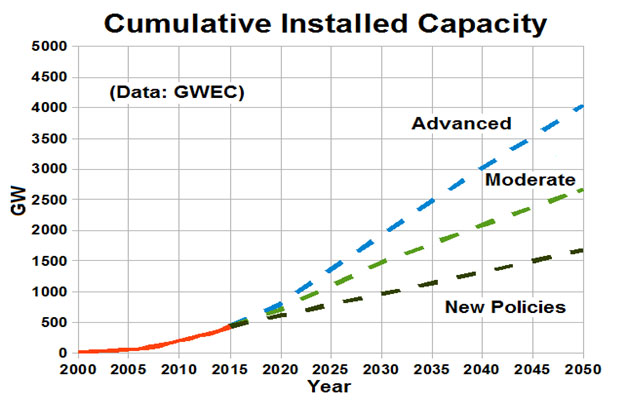
Figure 1: Cumulative installed wind capacity with forecasted data [3]
It can be seen that wind power has provided about 0.5 TW in 2015 which was roughly equal to 3% of the total power consumption in the world. Further, the contribution of wind power to the global power demand would not have exceeded 4.5 TW by 2050, according to the recent estimations [4]. Anyway, even at this capacity, wind power would potentially be able to provide one-seventh of the entire global power demand by 2050 (Global power demand has been forecasted to be 25-30 TW by 2050 [5]) and would have replaced as many as 4500 coal-powered power plants each with a capacity of 1000 MW.
In other words, wind power alone would be able to provide nearly 15% of the world’s energy demand by 2050. It would be a substantial contribution compared to the potential of other renewable energy sources that we discussed in previous articles.

As we all know hydropower is a renewable energy source and thus releases no harmful emission to the environment. Once a hydropower plant has been installed, it generates electricity at a minimal operational and maintenance cost. As such, they offer an extremely low cost per 1 kWh. They have long lifespans of more than 50 years and do not require frequent maintenance.
Hydropower offers many other unique advantages than any other form of renewable energy does. Some of them are as below.
Hydropower offers many benefits as mentioned above, but every story has two sides, hydropower plants come with some negative environmental impacts in some cases.
To conclude, hydropower comes with both pros and cons. But its advantages outweigh almost all of its own drawbacks. Especially, it represents not only a renewable source of energy but also one of the best and probably the most cost-effective tool in the supply-demand management and power quality enhancement. Therefore, increasing grid-connected hydroelectric capacity allows more and more renewable power to be grid-connected.
Simply, hydropower is a decisive factor in renewable energy industry not only as a renewable energy source but also as a tool which promotes other renewable energy sources.

The Archpedia seminar organized by the SLIA Resource Center, Board of Architectural Publications is scheduled to be held on the 25th of January 2018 from 4.30pm onwards at the SLIA, Auditorium.

The Jaffna International Trade Fair running for the 9th consecutive year from the 26th-28th of January 2018 at the Municipal Ground, opposite Subramaniam Park, Jaffna is the most comprehensive and focused exhibition held in the North since the dawning of peace.
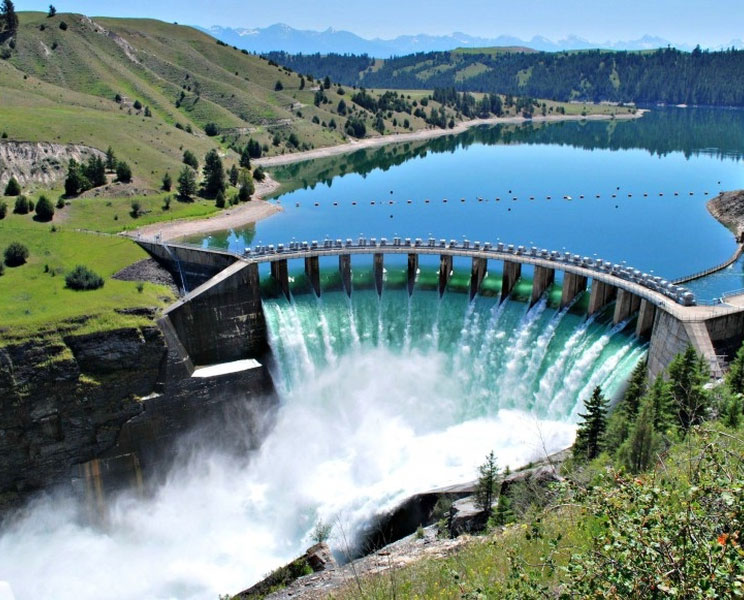
Hydropower is the oldest source of renewable energy that the mankind has been using to generate electricity in large-scale. It has a long history as a source of energy. It was used by ancient people for irrigation and to power some mechanical systems such as sawmills and flour mills. In the late 19thcentury, people realized that the kinetic energy of falling water could be coupled with a turbine and a generator to generate electricity. Thereby, world’s first hydropower plant was opened in 1882 on the Fox River in Appleton in the United States [1].
Unlike other renewable energy sources we discussed in previous articles, hydropower or power of water is widely being used around the globe and is the second largest contributor to the today’s renewable energy industry (Largest contributor is traditional biomass). It is a proven way of replacing the role of fossil fuels in electricity generation. One clear example would be Bhutan which is a carbon negative country thanks to its vast amount of hydropower available. Norway is another green country generating 98.9% of its electricity using hydropower [2]. In addition, many other countries are generating substantial amount of hydroelectricity.
It is needless to say that hydropower entirely relies on continuous supply of water from an elevated position. Water falling from an elevated position turns a turbine installed at a lower position. The electrical generator attached to the turbine thereby generates electricity to the rhythm of the water flows through the turbine.
Water enters the system at a higher position, deliver its kinetic energy to a turbine and exits the system at a lower position.
To keep the plant running (generating electricity), water should be continuously running through the turbine. In other words, water should be directed back to the higher position from the lower level. This is naturally done by the Sun in a process called “water cycle” or “Hydrologic cycle”.
The Sun’s heat evaporates water from the oceans, rivers, lakes, trees, soil and all the water bodies. Evaporated water molecules or Water vapor moves up and form clouds in the sky. Water molecules in clouds then cool and condense into raindrops or snow once the temperature reaches the dew point and fall back to the ground as precipitation. This process is a never-ending, cyclic natural process and therefore, is referred to as “water cycle”.
During the complete process, water is brought from lower levels to higher levels and thereby water stores Sun’s energy in the form of potential energy. Therefore, hydropower is an indirect source solar energy and is a renewable energy source.
Water cycle is the sole driving force of hydropower and ensures the continuous supply of water by which water is repeatedly cycled through the turbines.
A typical hydropower plant consists of a dam (not necessary for some cases), a turbine, an electrical generator and transmission lines.
First, the kinetic energy of falling water is converted into mechanical energy of turbines. An electrical generator attached to the turbine converts the mechanical energy of the turbine into electricity which is then distributed through power transmission lines.
Hydropower plants are often classified according to their operational principle as below.
Run of river (ROR) represents a type of hydropower which typically requires no or little water storage. ROR hydropower plants are extremely intermittent as they are not regulated by large storage or dams. However, they could be built with no or minimal alteration to the surrounding. In particular, environmental impacts of ROR hydropower plants are insignificant compared to conventional hydropower plants which require large-scale water storage, dams, onsite and nearby alterations.
Pumped-storage hydropower as its name suggests is a type of energy storage. These hydro power plants pump water to a higher elevation from a lower elevation during off-peak hours and thereby store energy surplus in the form of potential energy. During the peak hours, pumped water is released through a turbine to generate electricity.
The capacity of hydropower plants may range from few kilo watts to several Giga Watts. Depending on the size of power capacity, hydropower plants are categorized into several groups as mentioned below [3, 4].
Plants having capacity of 100 MW or more.
The worldwide technically accessible hydropower capacity has been estimated to be 2200 GW. However, only 25% of this figure is currently being used for electricity generation.
Plants having the capacity in the range of 25 MW-100 MW
Plants having the capacity in the range of 1 MW-25MW
Plants having the capacity in the range of 100 kW-MW
Plants having the capacity in the range of 5 kW-100 kW
Plants having the capacity of 5 kW or less
Unlike other energy sources we discussed in previous articles, hydropower can play a vital role in the renewable energy industry, especially in supply-demand management. In next article, we will further discuss hydropower in detail.
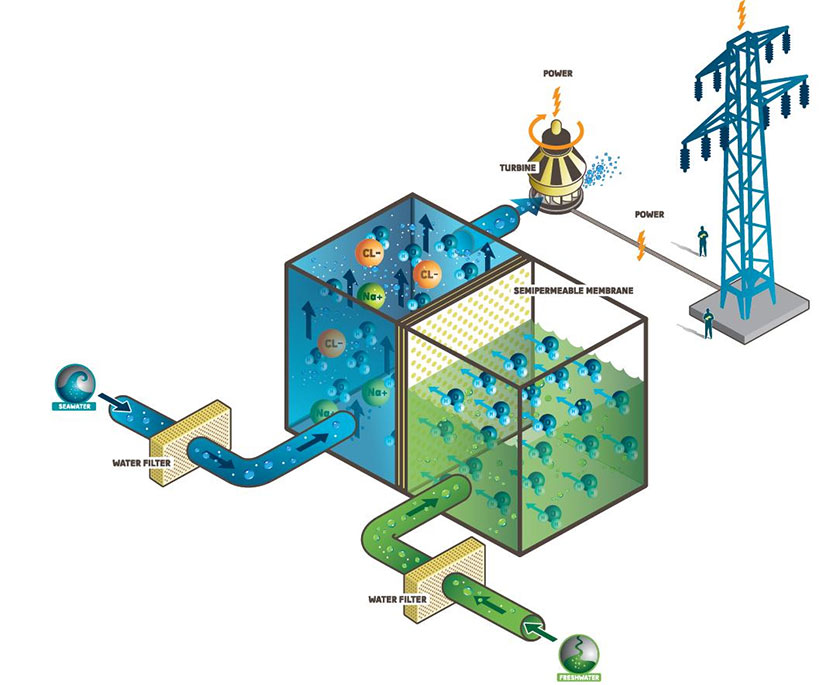
We have already discussed four major forms of ocean energy. All of them were well-known sources. Except ocean thermal energy, other three types represent kinetic energy of water in the ocean. In this article, we will focus on another form of ocean energy: It is osmosis power!
It does not represent kinetic energy of water in the ocean and therefore, nobody can identify its existence with the naked eyes.
It is sort of a latent energy and majority of the people have never heard of it!
Osmosis power relies on the difference in salt concentrations (salinity gradient) between two water bodies which meet at the same place. Usually, brackish or brine water and fresh river water are the two resources of choice.
The places where rivers meet the ocean are ideal for osmosis power plants.
As we know it, brine water is extremely saltier than fresh river water and therefore, there is a sizeable difference in the salinity of water where a river meets the ocean. When fresh river water mixes up with brine water it loses its osmotic pressure where a significant amount of energy is lost. This untapped energy could be harnessed to generate electricity. Osmosis power plants are sometimes known as salinity gradient power plants since this technology relies on the difference in the salinity (salinity gradient) of two water bodies.
Osmosis power attracted much attention during the energy crisis in the 1970s. But the perseverance largely waned with the falling oil price that happened in the early 1980s.
Osmosis power (blue energy) is still under its development stage and is an infant among all other forms of oceanic energy.
A typical osmosis power plant makes use of the osmosis pressure difference between two water bodies having different salt concentrations. They transform the osmosis pressure into a hydraulic pressure which is then used to turn a turbine attached to a generator.
Several technologies such as pressure retarded osmosis, reversed electrolysis and capacitive method have been already developed to generate electricity from osmosis pressure. However, none of the technology is uneconomically viable, unfortunately. It is still at its development stage.
Usually, an osmosis power plant employs semi permeable membrane by which water having two different salt concentrations are separated. The semi permeable membrane allows water molecules to pass through it. But it does not allow ions to go through it. It is, of course, an unfair treatment!!!
But plays an essential role in osmosis power harvesting.
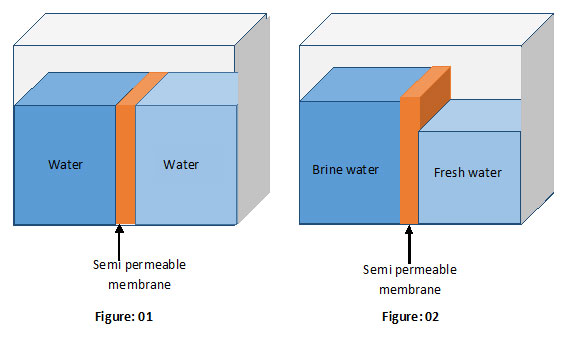
Say, you have fixed a semi permeable membrane in a storage tank as shown in the above figures. The membrane separates the tank into two parts.
We know that chemistry of materials always tries to equalize the ion concentrations of two materials in contact via a natural process called diffusion. Ions flow from the high-concentrated area to the low-concentrated area and eventually, ion concentrations in both sides become equal. But as mentioned earlier, semipermeable membranes used in osmosis power plants do not allow ions to pass through them but allow water molecules.
The consequence is amazing!
Say, you fill both chambers of the tank with the same liquid as shown in figure 1. You would see no change in the liquid levels with time.
But… What will happen if we fill two chambers with two different liquids (Liquids with two different concentrations)?
You may probably expect no change in the liquid levels with time though concentrations are different. If so, you are wrong.
The actual result definitely would surprise you!
Take a look at figure 2. It illustrates what happens if two partitions are filled with liquids having two different concentrations.
Isn’t it astonishing to see?
This unusual effect is a result of the diffusion. As mentioned earlier, diffusion of matter always tries to balance the ion concentrations of two liquids in contact. This is done by transferring the ions from high concentrated are to the low-concentrated area. But now we have installed a semi permeable membrane. It prevents the transition of ions from one chamber to the other. However, the same semi permeable membrane permits the water molecules to pass through it. Consequently, the membrane promotes the transition of water molecules from low-concentrated to high concentrated. This process reduces ion concentration in the high concentrated area while increasing concentration in the low-concentrated area. Eventually, the ion concentrations in both areas become equal.
You cannot observe the changes in ion concentrations in either side with your naked eye. But there is a curious, physically observable effect. It is nothing but what you can see in figure 2.
An increase in the water level at the high-concentrated area and a drop in the water level at low-concentrated area!
Obviously, it must occur since the semi membrane prevents the transition of ions but not water molecules. This process ultimately leads to a gap between the water levels (See figure 2).
A gap between the water (liquid) levels means a hydraulic pressure!
Osmosis power plants use this hydraulic pressure to turn a turbine and generate electricity.
However, none of the present-day technologies offers economically practicable opportunity to harness energy from this renewable source that has concealed in water bodies.
Hopefully, it would become an economically feasible in near future at least in highly saltier areas such as the Dead Sea, red sea and Atlantic Ocean [1, 2].
The worldwide osmosis power potential is approximately 2.6 TW [3]. It is higher than the worldwide wave power potential (2 TW) [4]. But it represents only 15% of the current global energy demand even at its full capacity and would further reduce to 4.1% by 2100 (Note that the global power demand would be 63 TW by 2100) [5].
[5] Hu, A., Levis, S., Meehl, G. A., Han, W., Washington, W. M., Oleson, K. W., and Strand, W. G. (2016). Impact of solar panels on global climate. Nature Climate Change, 6 (3), 290-294.

Climate is the average daily weather over a long period of time in a particular location. It is changed by both anthropogenic causes and natural phenomena such as volcanic eruptions and variations in solar radiation. Any change in the statistics of a climate system is commonly known as “climate change”. Anyhow, the term “climate change” is usually used to refer the anthropogenic climate change or change in the climate system due to human activities.
Climate scientists analyze some external measures such as ocean sediments, tree rings, ice cores and pollen remains to uncover the hidden history of climate. Recently, they ascertained that the earth’s climate has changed many times over long periods of time in the past. However, it has not abruptly changed in the previous millennium until the industrial revolution began and there was a certain pattern in the climate system which preserved the living beings including flora and fauna on this planet.
As we all know, climate conditions on the earth are decisive factors in determining the earth’s habitability. Unfortunately, it has been changing at an unexpected rate after the industrial revolution. This recent change in the climate system cannot be explained by natural phenomena alone and is attributed to various destructive human activities.
As mentioned above, current change in the climate system is predominantly manmade. Though there are many different anthropogenic causes of climate change, burning of fossil fuels seems to be the most terribly damaging cause. By burning fossil fuels, we release tons of heat trapping gases into the atmosphere at every point of time thereby increasing the amount of heat trapping gases in the atmosphere. This increase has resulted in a gradual increase in global temperature (global warming) and eventually unforeseen change in the entire global climate system that we experience today.
As we have already experienced, climate change affects health, agricultural industry, oceans, forests, economy and almost all the things on the earth. Climate scientists expect more frequent extreme events as we are pumping more and more pollutants into the atmosphere. More extreme events mean more deaths and more damages.
Climate change is not just another change but an aggravating issue which seems to be an origin of a massive devastation soon. Even a small change in the climate system could lead to a broad range of natural disasters such as frequent floods, heat waves, typhoons, heavy rains, wildfires, storms, droughts and many more. Some extreme events may be caused by natural phenomena. But most of these extreme events and disasters may be caused by anthropogenic climate.

Figure: Storm clouds
“Climate change” and “global warming” are interchangeably used in many contexts but have different meanings. Climate change explains alterations occurring in the global climate system in numerous ways whereas global warming is just one indicator of the changing climate. Global warming is simply the long-term increase in the global average temperature and is the most dominating, most damaging sign of the changing climate. Global warming leads to most of the natural disasters and extreme events. In next post, we will discuss the global warming from top to bottom.
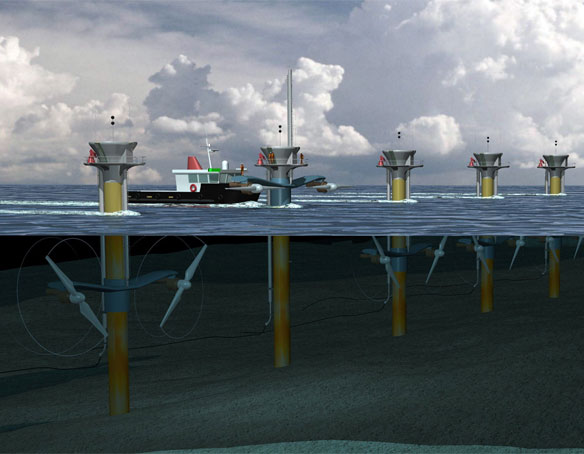
If you live in a coastal area or if you have ever been to a beach, you might have realized that the ocean is a massive reservoir of water with an unimaginable capacity!
The ocean is a really playful place.
Even though the deep sea looks like a calm place the ocean turns to be a wildly overwrought tiger in some locations especially, in the shallow areas.
It interacts with the wind, the Sun and the Lunar leading to different types of disturbances in the sea level and morphology of the ocean.
As we discussed in the previous article, the interaction between the ocean and wind results in ocean currents and waves. In this article, we will discuss another form of ocean energy: Tides!
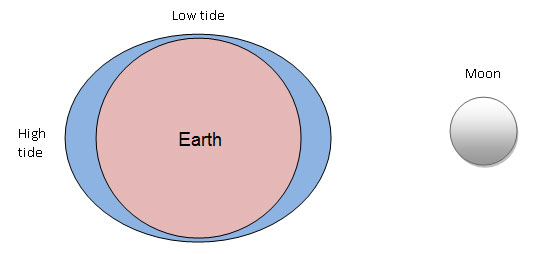
Tides are formed as a result of the gravitational interaction between the earth and moon. Of cause…. The gravitational interaction between earth and the Sun also causes tides but not as powerful as the tides that caused by the Lunar (Since we are far away from the Sun).
As we all know it, the moon revolves about the earth. Water in the oceans is pulled by the moon’s gravity when moon located just above the ocean. As a result, high tides occur on two sides of the earth simultaneously as shown in above figure. Low tides occur as a compensation, on another two opposite sides at the same time as shown in the same figure. The rise and fall of the sea level that occur twice a day are called tides.
Unlike other forms of ocean energy, tides represent neither direct solar energy nor indirect solar energy. Anyway, tidal power is also a renewable source of energy since tides are continually being replenished naturally. In other words, like all other renewable energy sources, tidal power would never be exhausted.
As long as the earth and noon exist tides would flood onto the shore and recede!
Tidal power has a well-matured technology with a long history compared to any other form of ocean energy. Some countries have already built tidal power barrages to generate electricity.
The first tidal barrage was born in Germany in 1912. However, it was damaged in World War I, unfortunately [1]. One of the famous and oldest tidal barrage built as early as 1966 at La Rance in France is still generating electricity with a power capacity of 240 MW [1, 2]. So it gives an exciting example of a successful tidal barrage built 5 decades ago.
Worldwide tidal power potential has been estimated at 3 TW. Obviously, we can’t install the tidal power devices everywhere since tidal power is highly site-specific. Simply, there are some technological and practical limitations in tidal energy harvesting. Only a few areas in the ocean are technologically and economically viable. Some areas are technologically suitable but are economically impracticable. These technological and economic challenges largely limit the amount of energy that could be harnessed from tides. It has been estimated that less than 3% of the global tidal power capacity is suitable for power generation [2, 3].
It is equal to 90 GW of power!
Remark: Global energy demand was around 17.5 TW in 2010 and it would reach 63 TW by next century (2100) according to the recent estimations [5].
So, what can we conclude?
Tidal power is a renewable energy source. It releases no harmful emission to the environment and therefore, does not intensify the climate change or global warming. However, the practically viable power capacity from tidal power is extremely limited compared to the current global energy demand.
[5] Hu, A., Levis, S., Meehl, G. A., Han, W., Washington, W. M., Oleson, K. W., and Strand, W. G. (2016). Impact of solar panels on global climate. Nature Climate Change, 6 (3), 290-294.

Ocean currents or marine currents are generally caused by wind, braking waves, salinity gradient and temperature gradient. As we realized earlier, wind and waves are forms of indirect solar energy. Both salinity gradient and temperature gradient represent the ocean thermal energy absorbed from solar energy by the oceans. So as we can see, ocean currents are also an indirect form of solar energy. They are connaturally formed and therefore, is a renewable source of energy.
It is needless to say both wind and ocean currents transport a huge amount of energy from one place to another. However, ocean currents transport can carry a large amount of energy per volume than winds (Note that density of water is 800 times that of air). So we can expect a significantly higher amount of power per area (W/ m-2) from ocean current conversion devices than that of wind turbines.
But…Ocean currents are still not widely being used to generate electricity though wind is widely being used especially in the Europe. This is largely due to technological challenges, high initial cost and site-specific nature of ocean currents. So, current energy harvesting technologies would have to be further developed prior to implementing them in commercial scale.
Waves are usually generated by the winds blowing over the oceans transferring energy to the sea water. They are continually formed since oceans are frequently influenced by the winds. Once waves are formed, they roll into the coast and are reflected back into the ocean. The energy gained by the ocean from winds appears as kinetic energy of water that linked to the waves. Since wind is an indirect form of solar energy, ocean waves also represent an indirect form of solar energy.
Ocean waves attracted a lot of attention as a potential source of renewable energy especially, during the energy crisis of the 1970s. However, wave power is not still being widely used.
There are some serious technological challenges, environmental impacts and some other drawbacks associated with wave power.
So,
What can we conclude?
Does wave power still offer an environmentally friendly renewable source of energy?
Yes of course!
Though wave power harvesting may result in environmental damages to a certain extent it is still environmentally benign compared to fossil fuels. Importantly, new wave power technologies are being developed to minimize the environmental impact and to make it cost-effective. Unlike fossil fuels, wave power would never run out. Throughout the day, throughout the year…They would be being created.
Wave power is still an untapped energy source. Though it is still an unpopular renewable energy source some countries such as Portugal, the UK, the USA, and Australia have already installed commercial-scale wave power harvesting devices while some other countries are planning to implement wave power harvesting projects in near future.
The worldwide wave power potential has been estimated to be about 2 TW [1]. It is equal to 10% of the world’s total power demand and is equivalent to two thousand coal-fired power plants each with a capacity of 1000 MW. So, global wave power potential at its full capacity can potentially shut down 2000 coal-powered power plants thus cutting an enormous amount of greenhouse emissions. Anyway, the contribution of global cumulative wave power capacity would be negligible even at its full capacity by 2100 as world’s power demand would have exceeded 63 TW by next century [2].
In next article, let us discuss the potential of other renewable energy sources and their practical capacities.

Earth, the third planet of the solar system is one and only known planet where life exists. Its water, fertile soil, the composition of the atmosphere and appropriate surface temperature make it a habitable place. Unlike any other member of the solar system, earth’s elegant waterfalls and lakes, lovely flora and fauna, fascinating forests and mountains, massive oceans and immensely creative ecosystems make it a magical place to all the living beings. So, it is not surprising that the natural beauty of the earth and its creativity amaze we all.
Earth is a home to thousands of animal and plant species. It provides food, water, medicine and almost all our requirements. Plants, waterfalls, flowers and mountains beautify the environment while humming of the birds delights our ears. The plants satiate our stomach while water quenches our thirst. The breeze cools down the surrounding and relieves our stress. Sun lights up the whole world. Plants purify air and produce food for us while we play on the ground. Nature is really a miraculous creation which has been programmed to heal small damages itself made by us. Our ancestors dealt with the environment with a minimal damage. They consumed only a small amount of natural resources. They loved nature. They worshipped nature. They respect nature. They did not destroy forests. They polluted neither air nor water nor soil. Simply, their activities did not lead to significant environmental damages. Nature does not punish us as long as we deal with it in a sustainable way. That is why our ancestors were not tortured by nature. They were really fortunate to respire pure air, to eat uncontaminated food, to drink clean water and to experience the beauty of nature. We can learn a lot about how our ancestors dealt with the environment by studying speeches of the most famous chief of the Duwamish and Squamish tribes, Seattle [1]. They protected the environment and encouraged their people to follow them.
But what happened after the industrial revolution that took place in Europe and North America?
Industrial revolution… sounds a music to our ears. But it was the date of birth of bad luck. As we all know, it has led to numerous environmental, social, health, economic and ecological problems. We all bear witness at least to one such terrible consequence. Let’s discuss them in the next article.

Industrial revolution which happened during the late 1700s and early 1800s is simply the process in which rural, agrarian people in Europe and North America became urban and industrial. It began in the United Kingdom and soon after, spread to nearby countries changing the processes of manufacturing and eventually the whole lifestyle. During Queen Victoria’s reign in the 19th century, Britain and most of the neighboring countries became industrial [1]. Therefore, her reign is considered to be a golden era in the human history.
During the industrial revolution, not only technology but also the society, economy and health services were developed and revolutionized. The advance in science technology paved the way to develop state of the art of manufacturing equipment and vehicles powered by either fossil fuels or electricity. The invention of steam engine and internal combustion engine turned upward down the manufacturing industry and also the transportation sector. Those inventions greatly increased the productivity with a similar expenditure of human energy. As a result, thousands of new manufacturing factories were born all over the world. Coal powered trains and then petrol and diesel-powered vehicles came onto the roads replacing the duty of horse. New electric appliances came into our homes and started to serve us replacing some of our work. All those inventions made the life comfortable and luxurious. We thought it was a revolution and so, named it an “industrial revolution”.

However, new industries and manufacturing plants required various types of materials such as iron and steel. And obviously, they required energy to power the equipment and vehicles. It was the beginning of large-scale mining for minerals and fossil fuels. We started to mine all over the earth. We did not limit it to the land. We then dived into the deep sea and started to mine the sea bed. Finally, the whole world exposed to the human beings, unfortunately. New factories and fossil fuel-powered power plants started polluting the environment in numerous ways while we have been digging the planet for resources.
Eventually, industrial revolution….revolutionized the human history. But the aftermath is a terrible tragedy.
Our planet will no longer be a livable place if we steadily damage the environment and disturb the environment sustainability at the current rate.

Figure 2: Cracked ground caused by drought
As the people always think of earning money and having a luxury life, they have already missed their duties and responsibilities that they have to implement for the endurance of the environment. They have done a catastrophe that highly affects the environment and that cannot be reversed ever. Nature punish us for the environmental damages made by us in various ways. For example, our prejudicial activities increase the frequency and intensity of environmental disasters such as floods, droughts, sea level rise, heat waves, cyclones, hurricanes. It has been shown that most of these extreme events and disasters are consequences of the climate change. Further, it has been clearly affirmed that human activities are the main causes of current climate change.
Climate change is responsible for many environmental problems that we face today. Therefore, we will deeply study the climate change, its causes and consequences with relevant evidence from the next article. Then, we will move onto discussing practicable solutions that we can implement to mitigate the disastrous impacts of climate change.
[1] Creighton, D. G. (1938). The Victorians and the Empire. Canadian Historical Review, 19(2), 138-153.

In the previous article, we discussed primarily natural climate change and anthropogenic climate change. Further, we realized that the global warming was just one indicator of the changing climate but was the most dominating, most damaging sign of the current changes in the climate system. In this article, we will focus on the global warming.
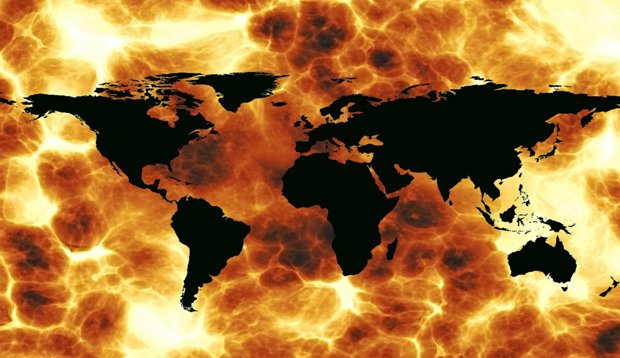
In brief, global warming refers to the increasing trend in the average temperature of the Earth’s surface and its lower atmosphere. As we discussed earlier, it is responsible for most of the natural disasters with which we are struggling today.
In order to fight against the increasing trend of the earth’s average temperature, a concrete understanding of the global warming is needed. This requires investigating, monitoring and modeling the changes in earth’s climate system.
Climate scientists have been closely monitoring the behaviors of earth’s climate system and deeply studying the changes in earth’s temperature exclusively after the 1950s. They use different kinds of climate models and measurements to investigate, study and model the earth’s climate. Following is results of one such study.
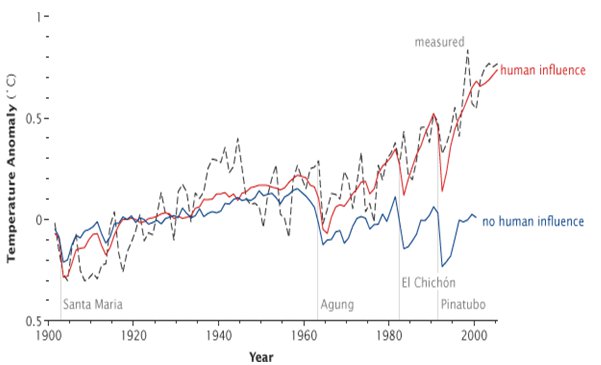
Graph 01: Temperature anomaly in the last century [1]
Above chart illustrates the changes in the global climate system over the past century, under three different scenarios namely measured (dotted line), human influence (red) and no human influence (blue). The dotted line represents the actual (measured) temperature anomaly over time. It can be observed that the global temperature has been gradually increasing even though some small fluctuations can be seen. The human influence on the temperature has been remarkably increasing after 1970. By analyzing the red and blue lines, one can easily realize what sort of damage to the climate system we have done. According to the chart, the human influence on the earth’s average temperature has been climbed up while the no human influence has been gradually declining. Especially, the chart reveals that the human influence has been abruptly increasing after 1985.
The sharp increase in the average temperature that we observe today is predominantly due to the anthropogenic causes. The average temperature has notably increased after the industrial revolution. In particular, it has remarkably increased after the 1950s. It has been estimated that the average temperature of the earth has risen 0.9± 0.05 ˚C at 95% confidence since the 1950s unto the present [1]. Further, the intergovernmental panel on climate change (IPCC) has forecasted a massive jump in the average global temperature by 2100. According to their estimations, the increase in the average temperature will be in the range of 1.4- 5.8 ˚C [2].
An increase of 0.9 ˚C in the average temperature changed the entire climate system leading to many natural disasters and extreme events.
So…
What will happen once the temperature rises further by 1.4 ˚C (in the lowest possible scenario)?
What will happen once the temperature rises further by 5.8 ˚C (in a worst case scenario)?
It is worth thinking but attempts stopping one’s heart.
Heavy use of fossil fuels and deforestation are two main anthropogenic causes of global warming. These human activities increase the concentration of heat trapping gases in the earth’s atmosphere causing the earth to warm up. The mechanism by which the earth’s atmosphere warms the earth’s surface and lower atmosphere is technically referred to as “greenhouse effect”. Next article will focus on natural greenhouse effect its importance and the enhanced greenhouse effect.

The greenhouse effect is the process by which the earth’s surface and its lower atmospheres are warmed up. Its mechanism was first suggested by Joseph Fourier in 1824 and experimentally confirmed by John Tyndall in 1860 [1]. Since then, much effort has been devoted to fully understand its mechanism, causes and consequences.
We can easily understand the mechanism of the greenhouse effect if we know how an actual greenhouse keeps its inside warmer. In fact, the mechanism by which the warmed atmosphere of a planet warms its planet’s surface and lower atmosphere is somewhat different from the mechanism by which an actual greenhouse warms up. However, there is a stunning analogy between them.

Figure: Structure of a greenhouse [2]
An actual greenhouse warms up due to the reduced convective heat transfer. The glass of a greenhouse lets sunlight to go through them which in turn warms the ground inside. The warmed ground then acts as a heated body and emits longwave radiation (IR) thereby warming the air inside. However, the warmed air is not allowed to escape from the house as the house is almost closed. This stops the natural convection and prevents the inside from cooling. So, the eventual result is a warmer indoor.
The greenhouse effect is not a result of blocked convection but a process governed by heat-trapping gases in the atmosphere. The greenhouse gases in the atmosphere are transparent to the shortwave radiation (visible light) but opaque to the longwave radiation (IR). As a result, visible light reaches the earth surface. In this case, it is important to know that much of the solar radiation comes as visible light. A certain portion of the incident solar radiation is reflected back to the outer space by the earth’s surface. However, the remaining incident radiation warms the earth’s surface up. The hot earth’s surface acts as a black body and radiated its heat energy out. But this radiation from the earth is not allowed to escape directly from the earth’s atmosphere and is trapped by the heat-trapping gases (absorbed). The following figure illustrates how the greenhouse effect works.
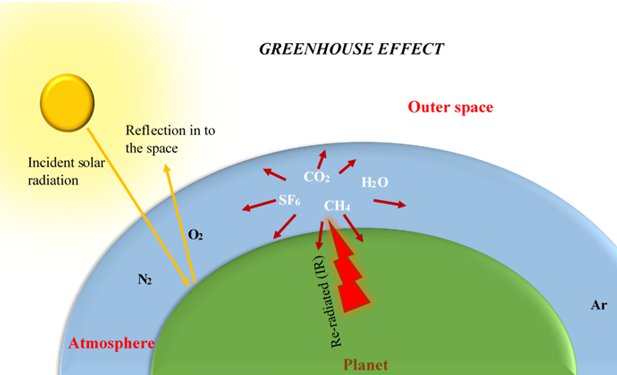
As we all know, earth’s average surface temperature does not exceed at least 50 ˚C. So, much of the earth’s surface heat radiates longwave radiation (not shortwave radiation). This can be easily understood by treating the earth’s surface as a black body whose temperature is always less than 50 ˚C. Unlike shortwave radiation, longwave radiation is absorbed by greenhouse gases even though some of the longwave radiation passes through the atmosphere. The greenhouse gases then re-emit the absorbed radiation to all directions including towards the earth. As a result, the earth’s temperature always remains at a higher temperature than that we would expect if there was no greenhouse effect. This warming effect is somewhat analogous to that of a greenhouse and therefore is referred to as the greenhouse effect.
The natural greenhouse effect is one of the key factors in determining the habitability of a planet. But human activities improve the greenhouse effect making the planet warmer than it was in the past. In next articles, we will discuss natural and enhanced greenhouse effect in detail.

Greenhouse effect caused by naturally occurring greenhouse gases is not at all harmful to the human kinds, animals or plants. It helps maintain the earth’s temperature at a mild, habitable and relatively even level.
No doubt… If there was no greenhouse effect, the earth wouldn’t have supported lives.
Let’s take a look at an example…. The moon!
The average distance to the moon from the sun is approximately the same as that of the earth. The moon has no sufficient gravity to retain an atmosphere and therefore, no active greenhouse effect. As a result, its surface temperature declines to -153 ˚C during the night-time even though its temperature may reach about 107 ˚C in the daytime [1].
See the difference!
The earth’s surface temperature would also have a very offensive variation in the daytime and night-time if there was no greenhouse effect to trap the heat from the sun in the daytime. Simply, the greenhouse effect is the temperature regulator of the earth.
Then WHY worry?
The problem arises when humans’ activities lead to boost the greenhouse effect making the effect more powerful and detrimental. We all contribute to the greenhouse effect …pumping tons of emissions into the atmosphere.
Everyday!!!
Directly or indirectly…
In various ways…..
You may be driving a car. You may be watching TV. Meanwhile…knowingly or unknowingly, willingly or unwillingly…You are enhancing the greenhouse effect and are warming the earth.
Earth’s surface temperature always remains at a higher temperature than the temperature we would expect without accounting for the atmosphere’s influence on it. Earth’s atmosphere’s influence on its surface temperature is what makes it a living planet, supporting life. However, some of our day to day activities (predominantly fossil fuel burning) boost the greenhouse effect leading to the global warming. The enhanced amount of the greenhouse effect is known as the enhanced greenhouse effect which results in global warming.
So, it is obviously manmade!
Many research projects have been devoted to find out the causes of global warming, to measure the individual influence of those causes and to model the changes in the climate system.
Following graphical representation quantitatively illustrates the contribution of different forcing factors to the global warming over the last century. It can be clearly observed that greenhouse gases were the main contributors. Unlike other forcing factors whose effects are either gradually decreasing or fluctuating, the effect of the greenhouse gases on the global warming has appallingly increased over time.
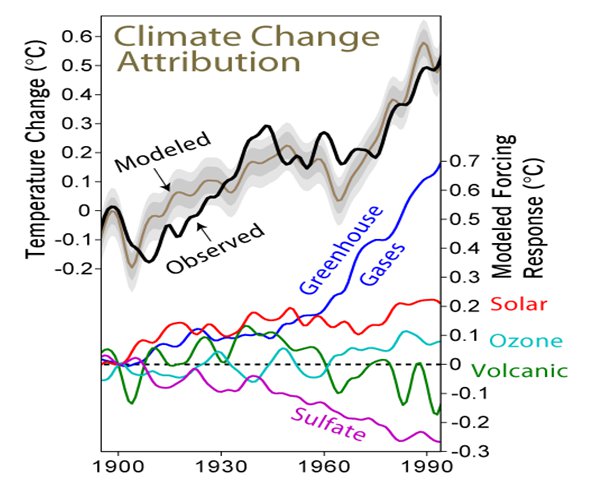
Figure 1: Impacts of different forcing factors on the global warming
The most important greenhouse gases are carbon dioxide, methane, water vapor and nitrous oxide. In addition, chlorofluorocarbons and some other gases contribute to the global warming and thus are greenhouse gases.
Most of the greenhouse gases occur naturally in the atmosphere and they are not harmful to the environment as long as they are in balance. They are very important to keep the planet warm. Earth would have become a cold, uninhabitable place and therefore another dead planet if its atmosphere contained no greenhouse gases. However, when their compositions exceed the natural level, the system becomes unbalanced leading to global warming which in turn brings natural disasters and extreme events.
When we look at all these things, we can realize that the global warming has now turned into a global war since the whole world has been affected. But….. There are some potential ways which can greatly help mitigate the problem of global warming and eventually to lower the global average temperature. We all have a responsibility in the battle with global warming.
From next article, we will mainly focus on climate change mitigation and adaptation.

In previous articles, we clearly realized that both human activities and natural phenomena are responsible for the current change in the global climate system. Further, we understood that the damaging effects of anthropogenic causes are more adverse than those of the natural phenomena.
We all are struggling in the changing climate in our day to day life. As we discussed, climate change results in disasters and deadly extreme events. Droughts, floods, cyclones, heat waves and sea level rise are just a few. The increasing trend of the climate change means frequent and more dreadful disasters, more deaths and economic losses. Our future would be most vulnerable as anthropogenic greenhouse gases continue to accumulate in the atmosphere accelerating the climate change. We need to address the root causes in order to tackle or decelerate the climate change.
Climate change is largely governed by greenhouse gases in the atmosphere. So, almost every attempt of fighting against the climate change requires depressing the concentration of atmospheric greenhouse gasses. There are two primary approaches to lower the atmospheric greenhouse gases: Removal of greenhouse gases from the atmosphere (carbon sequestration) and reducing the emission of greenhouse gases. As a whole, any anthropogenic intervention of lowering the emissions and enhancing the sinks of greenhouse gases could be defined as a climate change mitigation strategy.
To begin with, let’s see how to remove greenhouse gases from the atmosphere. There are dozens of natural and artificial greenhouse gas removal mechanisms. Generally, both natural and artificial reservoirs which absorb and store greenhouse gases are known as sinks. Trees, oceans and soils and savanna are the most important natural sinks. Anyway, we have nothing to do with natural mechanisms of sinks. So,
Let the trees do their job.
Let the oceans do their job.
Let the soils do their job.
And let’s do what we must do.
It is our duty to enhance the capacity of sinks and minimize our emissions.
Reforestation and carbon dioxide capture at power plants would play a vital role in carbon dioxide sequestration. However, the potential of artificial greenhouse gas removing is limited in the game of climate change mitigation due to economic and technological challenges. Reforestation would be a great option but does not seem to be practical in most cases since ever-increasing human needs require more and more lands. So, the truth is that our planet is not going to accommodate more trees.
Therefore, in practice, it is clear that removal of greenhouse gases from the atmosphere is an extremely challenging task.
Now let’s take a look at the following example to see why it is challenging.
A plant would take about 40 years to sequester one ton of carbon dioxide [1] whereas you add the same amount of carbon dioxide by driving your car around 5000 km [2]. Simply, pumping a ton of greenhouse gases into the atmosphere is much easier than removing the same amount from the atmosphere.
Considering all these facts, we can conclude that the most effective way of mitigating the climate change is nothing but minimizing the emissions. In next article, let’s study most forceful strategies to minimize anthropogenic emissions.
Generally, water vapor, carbon dioxide (CO2), CFC, methane (CH4), and also nitrous oxide (N2O) contribute to the greenhouse effect and therefore, are known as greenhouse gases.
Water vapor is the most dominant greenhouse gas. However, the concentration of water vapor is largely determined by the atmospheric temperature. Higher temperatures promote the evaporation of water and consequently increase the concentration of water vapor in the atmosphere which in turn intensifies the global warming.
This implies that the largest contributor to the climate change, water vapor is not a root cause of global warming but a product of global warming caused by other greenhouse gases. Can you imagine?
It is a vicious cycle!
Let’s take a look at the following pie chart to find out the correct answer. It illustrates the contribution of individual greenhouse gases to the greenhouse effect (Without considering the effect of water vapor). We can see that carbon dioxide alone accounts for 55% of the warming effect.
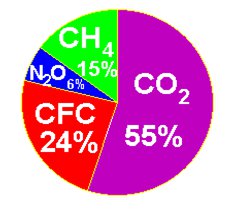
Figure 1: Contribution of greenhouse gases to the greenhouse effect [1]
Since water vapor is a result of global warming, the second largest contributor to the climate change, carbon dioxide is considered to be the most deleterious greenhouse gas.
This implies we must lower the concentration of carbon dioxide in the atmosphere in order to mitigate the climate change successfully.
To begin with, let’s see…what are the anthropogenic sources of greenhouse gases?
Greenhouse gases are produced in various human activities where power plants, vehicles, cement plants, mining plants and industries are the most dominant sources. Just take a look at the following pie chart. It shows the annual greenhouse gas emissions, in 2005, by sector. It can be seen that the electricity generation and heating make up nearly a quarter of the total greenhouse gas emissions while transportation sector accounts for 14.3% of the emissions. Further, it can be perceived that the combustion of fuels (electricity, heating, transportation, etc.) as a whole accounts for nearly 50% of the total amount of greenhouse gas emissions.
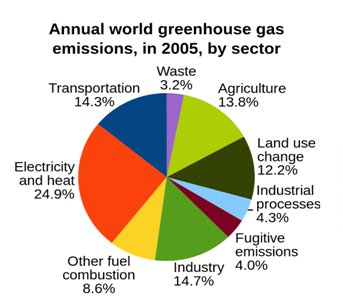
Figure 2: Annual world greenhouse gas emissions, in 2005, by sector
As we can see, fuels (crude oil, coal and natural gas) are the largest sources of greenhouse gases (especially CO2, N2O and SO2) and key contributors to the climate change. So, it is obvious that our fight against the climate change requires to minimize our fuel consumption. Efficient use of energy and energy efficient appliances are proven ways to minimize the energy demand. However, rapidly increasing demand for energy requires more and more energy and thus more fuels.
Keep in mind: Even a significantly improved modern coal-fired power plant with a capacity of 1000 MW pumps six million tons of emissions into the atmosphere annually! [1]
We need to minimize the fossil fuel consumption. But we need more and more fossil fuels to fulfil the ever-increasing demand for energy since fossil fuels are our primary source of energy.
We are really on the horns of a dilemma!
How to deal with this impasse?
The short answer is searching for alternatives to the fossil fuels: renewable energy sources.
In next article, let’s focus on renewable energy sources and their importance in climate change mitigation.
Energy, the ability to do work is one of the basic needs in our daily life. We can’t think of a life without energy. We need energy to power vehicles, electrical appliances, industrial machinery, and for almost every task!
Energy exists in several forms including heat, kinetic energy, potential energy, electrical energy and light or radiation. Energy comes from various types of sources called energy sources. Our planet is abundant in energy sources though fossil fuels still play a vital role as our primary source of energy. Any alternative to fossil fuels is an alternative energy source. There are so many alternative energy sources. However, some of the alternative energy sources are non-renewable. For example, nuclear fuels are alternative energy sources but are not renewable. Once we have consumed them they are gone.
Renewable energy sources are energy sources which are naturally and continually replenished in a short period of time on the human timescale. Following are the most attractive sources of energy which are currently being used or developed.
It is worth understanding that fossil fuels are also continually formed by natural processes but take millions of years to form. As a consequent, fossil fuels are being rapidly depleted due to our consumption. That is why fossil fuels are not considered to be renewable.
Your car would take 10 minutes to drive 15 km and would consume one liter of petrol. However, natural processes by which fossil fuels are formed would take millions of years to form the same amount of fuel.
Contribution of renewable energy to the global energy demand
Following pie chart shows the proportion of global energy production provided by different energy sources in 2013. We can see that only 19% of the world energy consumption in 2013 has been provided by renewable energy sources while 78.4% of the consumption has been provided by fossil fuels. In addition, the chart clearly shows that almost one-tenth of the world’s energy consumption or half the renewable energy capacity in 2013 has been met by traditional biomass such as wood and cow dung. Moreover, one-fifth of the renewable energy capacity has been provided by hydropower. As we can see the contribution of direct solar energy to the global energy demand in 2013 is less than 0.25%.
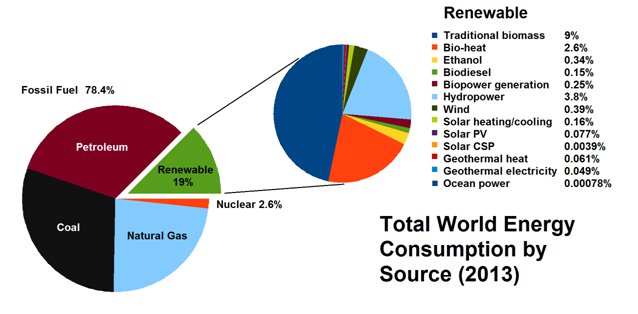
Figure 1: Global energy consumption by source [1]
We have already discussed the detrimental effects caused by fossil fuel combustion. Further, we realized that fossil fuels are rapidly being exhausted. However, we still need energy. So, renewable energy is the best solution.
They are not depleted.
And they are abundant in nature.
They have minimal environmental effects.
Most of the renewable energy sources release only a negligible amount of emissions compared to the fossil fuels and so provide the best solution to mitigate the climate change.
Renewable energy is everywhere from our backyard to the rooftop and from the North Pole to the South Pole. But still, we heavily rely on fossil fuels and while struggling with the environmental impacts associated with fossil fuel combustion, unfortunately.
Let us discuss renewable energy in more detail in next article.
As we discussed in the previous article, the contribution of renewable energy to the global energy demand was 19% in 2013. Today, renewable energy sources account for 23% of the global electricity generation [2].
See the gap. Fossil fuels still provide 77% of the global electricity demand.
Think of how far away we are from our dream of 100% renewable energy.
Is it possible to replace fossil fuels with renewables 100%?
Prior to answer this question, let’s take a look at some real global energy facts.
Global energy demand is not something at rest but a rapidly increasing demand.
It is crystal clear that a single source of renewable energy cannot replace the demand for fossil fuels. Nothing to worry!
There are plenty of renewable energy sources around us. They can provide more than enough energy we need. Now let’s talk about different forms of renewable energy and how much of energy they can provide us.
The ocean is the largest reservoir of water as we know it. It is not only a reservoir of water but also a massive reservoir of energy and is the largest energy storage on the earth. It covers nearly 71% of the earth’s surface [3] and receives an enormous amount of solar energy throughout the day. A considerable portion of the received energy is trapped in sea water and appears as heat. In addition to the direct solar energy, oceans grab an enormous amount of energy from the wind blowing over them. This results in ocean waves. Not only that, oceans acquire a considerable amount of energy from the gravitational energy of both earth-moon system and earth-sun system. The energy gained by the oceans appear as heat, waves, currents and tides.
The heat trapped by the oceans (ocean thermal energy) could be used to generate electricity. Ocean thermal energy conversion (OTEC) technology takes the advantage of temperature difference exists between shallow sea water (hot) and deep sea water (cold) to generate electricity. It is needless to emphasize that the oceans are huge heat reservoirs with an incredible amount of trapped heat from solar energy. However, the practical conversion efficiency in OTEC is very poor due to the Carnot’s limitation which limits the efficiency of any heat engine. This poor conversion efficiency limits the maximum steady-state OTEC electrical power capacity to about 10 TW [4].
Compare this value (10 TW) with the current energy demand (17.5 TW) and projected energy demand to 2100 (63 TW).

(Font sizes are proportional to the value of each number)
OTEC technology would increase the renewable energy share and help alleviate the climate change to a certain extent anyway. But it is clear that current OTEC technology is not smart enough to meet the increasing energy demand even at its full capacity.
Though OTEC is an environmentally benign technology compared to the fossil fuels it still possesses some disadvantages. OTEC power plants release some toxic chemicals such as ammonia and chlorine to the surrounding. Especially, the operation of an OTEC plant may seriously affect the marine environment including marine lives.
In next article, we will talk about other sources of renewable energy and their potential to replace the fossil fuels thereby reducing our carbon footprint.
சூரிய சக்தி யுத்தத்தில் முன்னேற்றமான மாற்றம் சூரியபல சங்ராமய 20 வருட ஒப்பந்த காலத்தின் கீழ் நடைமுறைப்படுத்தப்படும் இத் திட்டத்தின் மூலம் நீங்களும் ஒரு மின்சார உற்பத்தியாளராக முடியும். ஒரு மில்லியன் குடும்பங்களுக்கு மேலதிக வருமானம். மின்சார பாவனையாளராகவும் மின் உற்பத்தியாளராகவும். இத்திட்டத்தின் பிரதான நோக்கம் 20% குறைவான வருமானமுடைய குடும்பங்களுக்கு அறிமுகப்படுத்தல் ஆகும். இதனால் குறைவான வருமானமுடைய 2 லட்சம் குடும்பங்கள் நவீனமுறையின் கீழ் மின்சார உற்பத்தியாளர்களாக உருவாக்கப்படுவர்.
The battle of solar power getting a progressive turn with “Soorya Bala Sangramaya” through which, for a 20 year period, under the agreement electricity can be added to the system.

වසර 20ක ගිවිසුම් කාලයක් යටතේ ක්රියාත්මක වන මෙම වැඩසටහන තුලින් නිවාස 1,000,000ක සූර්ය බලාගාර පිහිටුවමින් රට බල ශක්තියෙන් ස්වයංපෝෂිත කිරීම අරමුණු කොට ඇති අතර මෙම සූර්ය බලාගාර 1,000,000 අතරින් 20%ක් වත් අඩු අදායම් ලාභී පවුල් වලට ලබා දීම තුලින් අඩු ආදායම් ලාභී පවුල් ලක්ෂ 02ක් නව ක්රමය යටතේ විදුලි නිෂ්පාදකයන් බවට පත් කිරීමට බලාපොරොත්තු වේ.

The pioneer in Sri Lanka’s residential solar power electrification, JLanka Technologies introduced the company’s latest innovation ePro1000. Sri Lanka’s first Smart meter device, ePro1000 helps every home and office to monitor and manage the electricity consumption and all other electricity parameters.
_compared_to_observations_(NASA).png)
Recent Comments